Altcoin
Stellar (XLM) price prediction – Traders, these are the key levels to watch!
The next few days could be key in determining where XLM’s price goes next.
- XLM was trading below the 200 Exponential Moving Average (EMA) on the daily timeframe
- XLM’s price could decline by 12% to $0.083 if it closes a daily candle below $0.0915
Stellar (XLM), at the time of writing, seemed poised for a potential downside move after breaking down from a double-top price action pattern. This is important, especially since right now the overall sentiment across the cryptocurrency landscape is bearish. And, top cryptocurrencies have been seeing significant selling pressure lately.
Double-top breakdown signals a bearish outlook
Based on the price action and technical analysis, the double top is a bearish pattern which signals a potential sharp price decline after breaking down from its neckline.
In addition to this bearish outlook from the price action pattern, XLM was also trading below the 200 Exponential Moving Average (EMA) on a daily timeframe, indicating it has been on a downtrend.
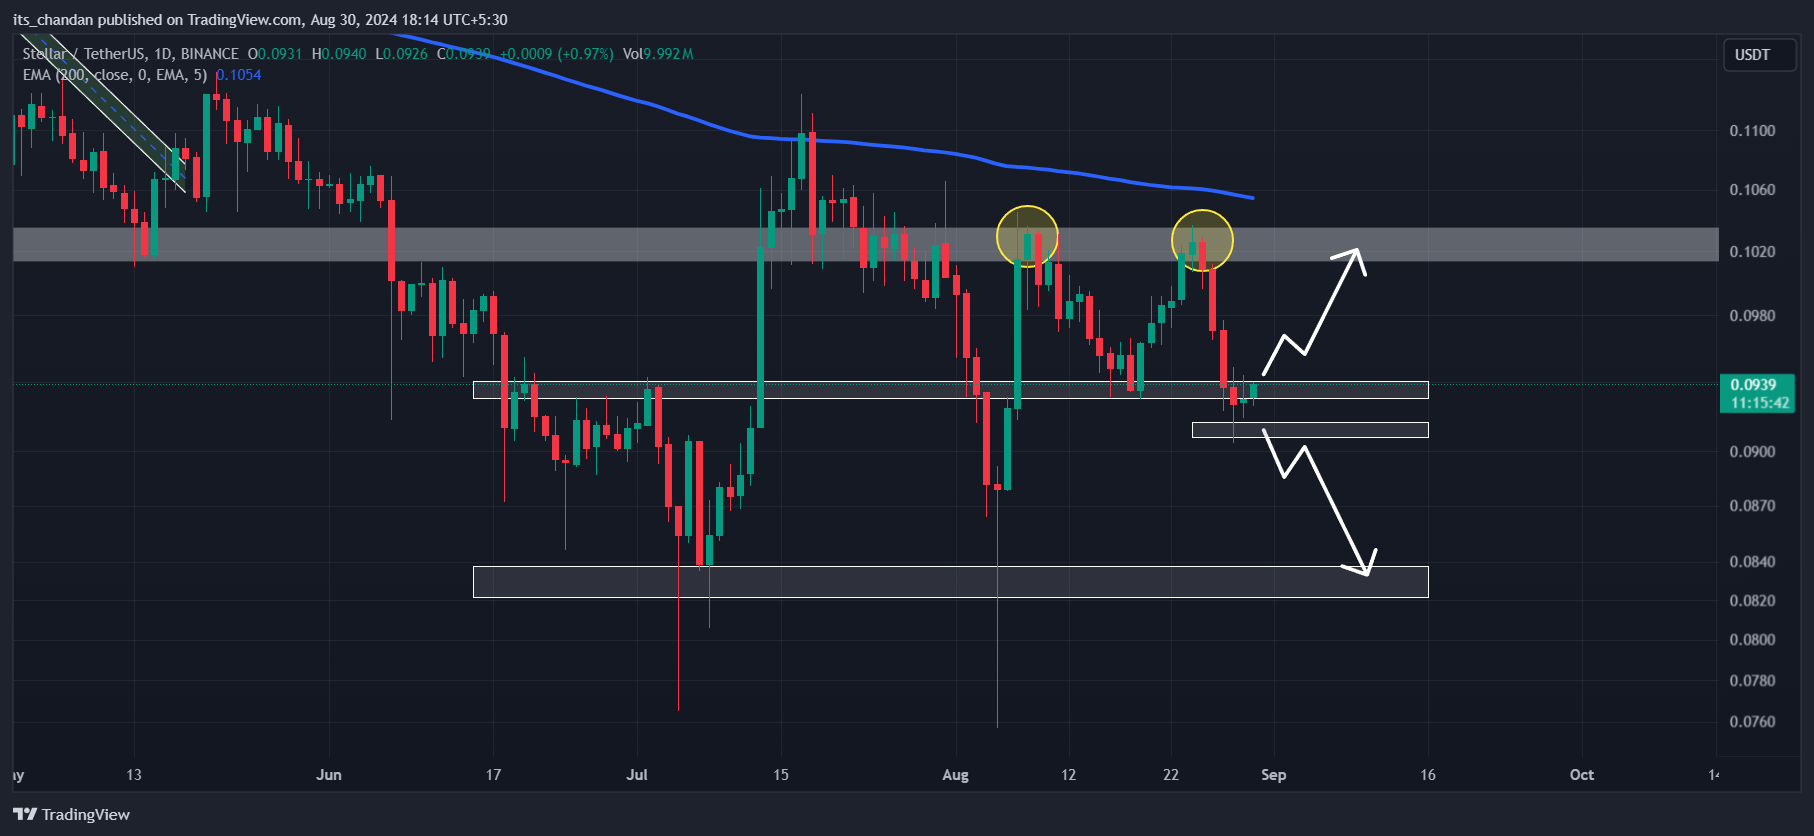
Source: TradingView
Owing to these factors, there is a high possibility that XLM’s price could decline by 12% to $0.083 in the coming days. However, traders should wait until the daily candle closes below $0.0915.
If this happens, it would confirm a successful breakdown.
Liquidation levels and market sentiment
Right now, the major liquidation levels are near the $0.091-level on the lower side and $0.0948 on the upper side. This, according to data from the on-chain analytics firm CoinGlass.
In fact, this data also indicated that traders are over-leveraged at these levels.
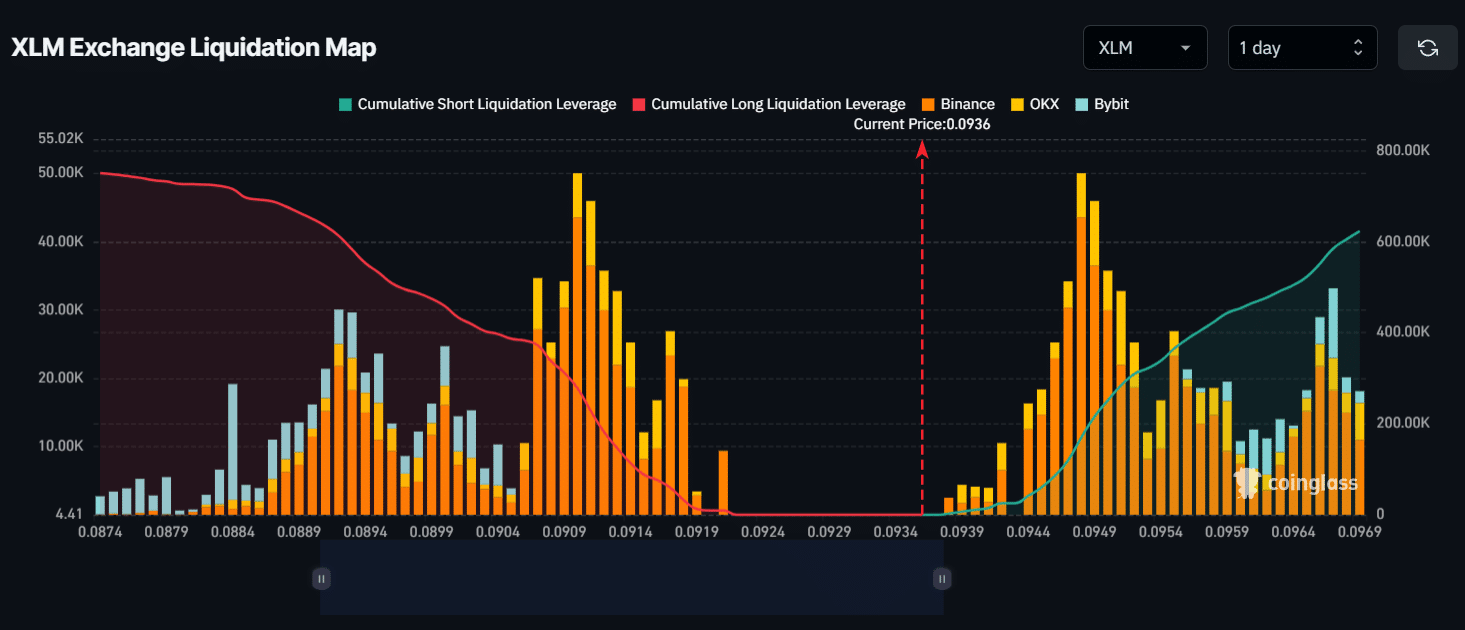
Source: CoinGlass
If the market sentiment remains unchanged and XLM falls to the $0.091-level, nearly $280,000 worth of long positions will be liquidated. Conversely, if the sentiment shifts and the price jumps to the $0.0948-level, $170,000 worth of short positions will be liquidated.
On-chain metrics and XLM price analysis
Additionally, CoinGlass’s exchange liquidation map suggested that sellers have been less dominant lately. Also, it implied that XLM may see a price reversal, despite undergoing a crucial breakdown.
Here, it’s worth looking at another on-chain indicator – OI-weighted funding rate. It is used to track market sentiment and helps in forecasting potential upside movement in an asset’s price. According to CoinGlass, XLM’s OI-weighted funding rate is positive, with the same having a figure of 0.0019% at press time.
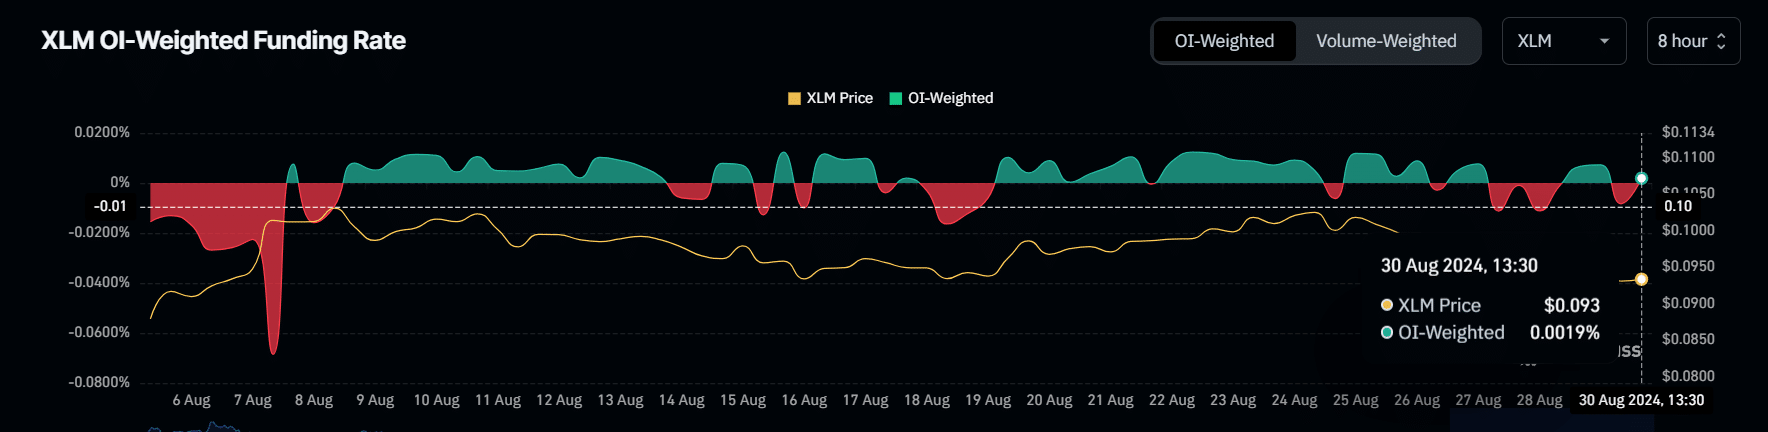
Source: CoinGlass
Considering all these metrics and the price action, it is difficult to forecast where the price will head in the coming days. However, the outlook could change if XLM closes a daily candle below the $0.0915-level.
At press time, XLM was trading near the $0.0938-level after seeing a modest price decline of 0.2% in the last 24 hours. Meanwhile, its Open Interest also dropped by 2.3% during the same period, indicating lower interest from traders amid the market’s downturn.