Stellar [XLM] traders can capitalize on this pattern’s break

At press time, Stellar [XLM] was walking on eggshells while witnessing a fierce clash between the buyers and sellers in the $0.13-zone. A close below ascending channel could spiral into undesired losses by opening a door toward the $0.12-zone.
But any upswings from the lower trendline of the up-channel would position the altcoin for a short-term revival. At the time of writing, XLM traded at $0.1376, down by 7.71% in the last 24 hours.
XLM Daily Chart
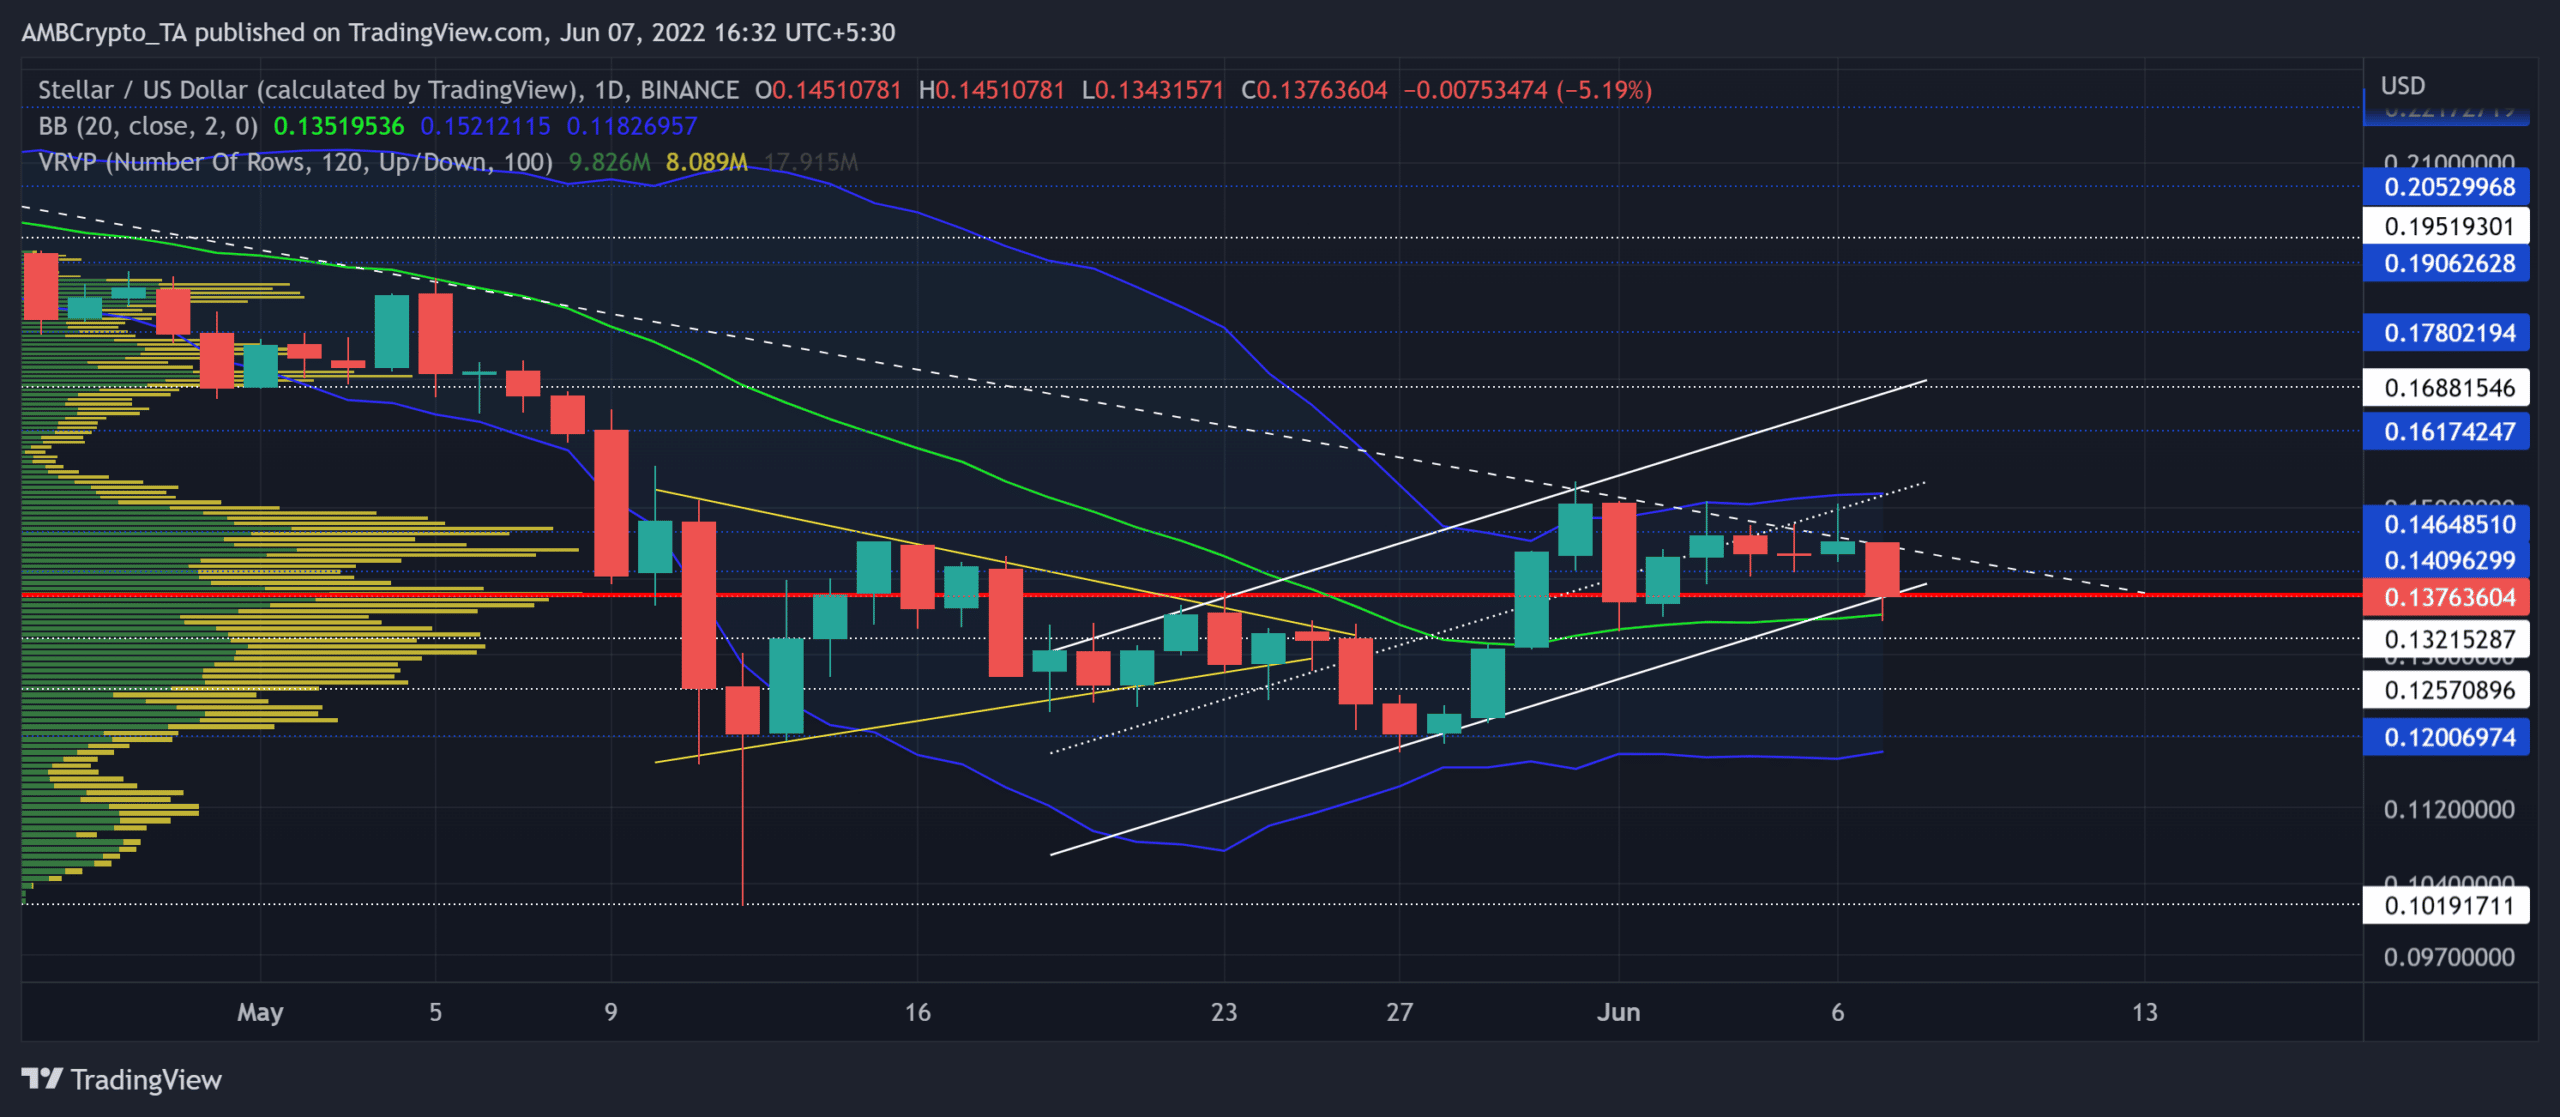
XLM took a u-turn from the $0.2-level as the bears quickly stepped in to reverse the effects of the previous down-channel breakout. This bearish pull marked a two-month trendline resistance (white, dashed) on its daily chart. The alt lost nearly 57% (from its April highs) and hit its 17-month low on 12 May.
This trendline resistance has constricted most recovery over the last two months. While the recent bearish pennant breakdown transposed into an up-channel, XLM found a close above the basis line (green) of the Bollinger Bands (BB).
Should the bulls find renewed pressure to maintain the up-channel, they would aim to break above the $0.1464-resistance. A close beyond this level would pave a path toward the $0.16-zone near the upper trendline of the up-channel.
On the flip side, a continued onslaught could provoke a fall below the basis line of BB. In this case, the $0.12-$0.13 range should provide reliable rebounding opportunities.
Rationale
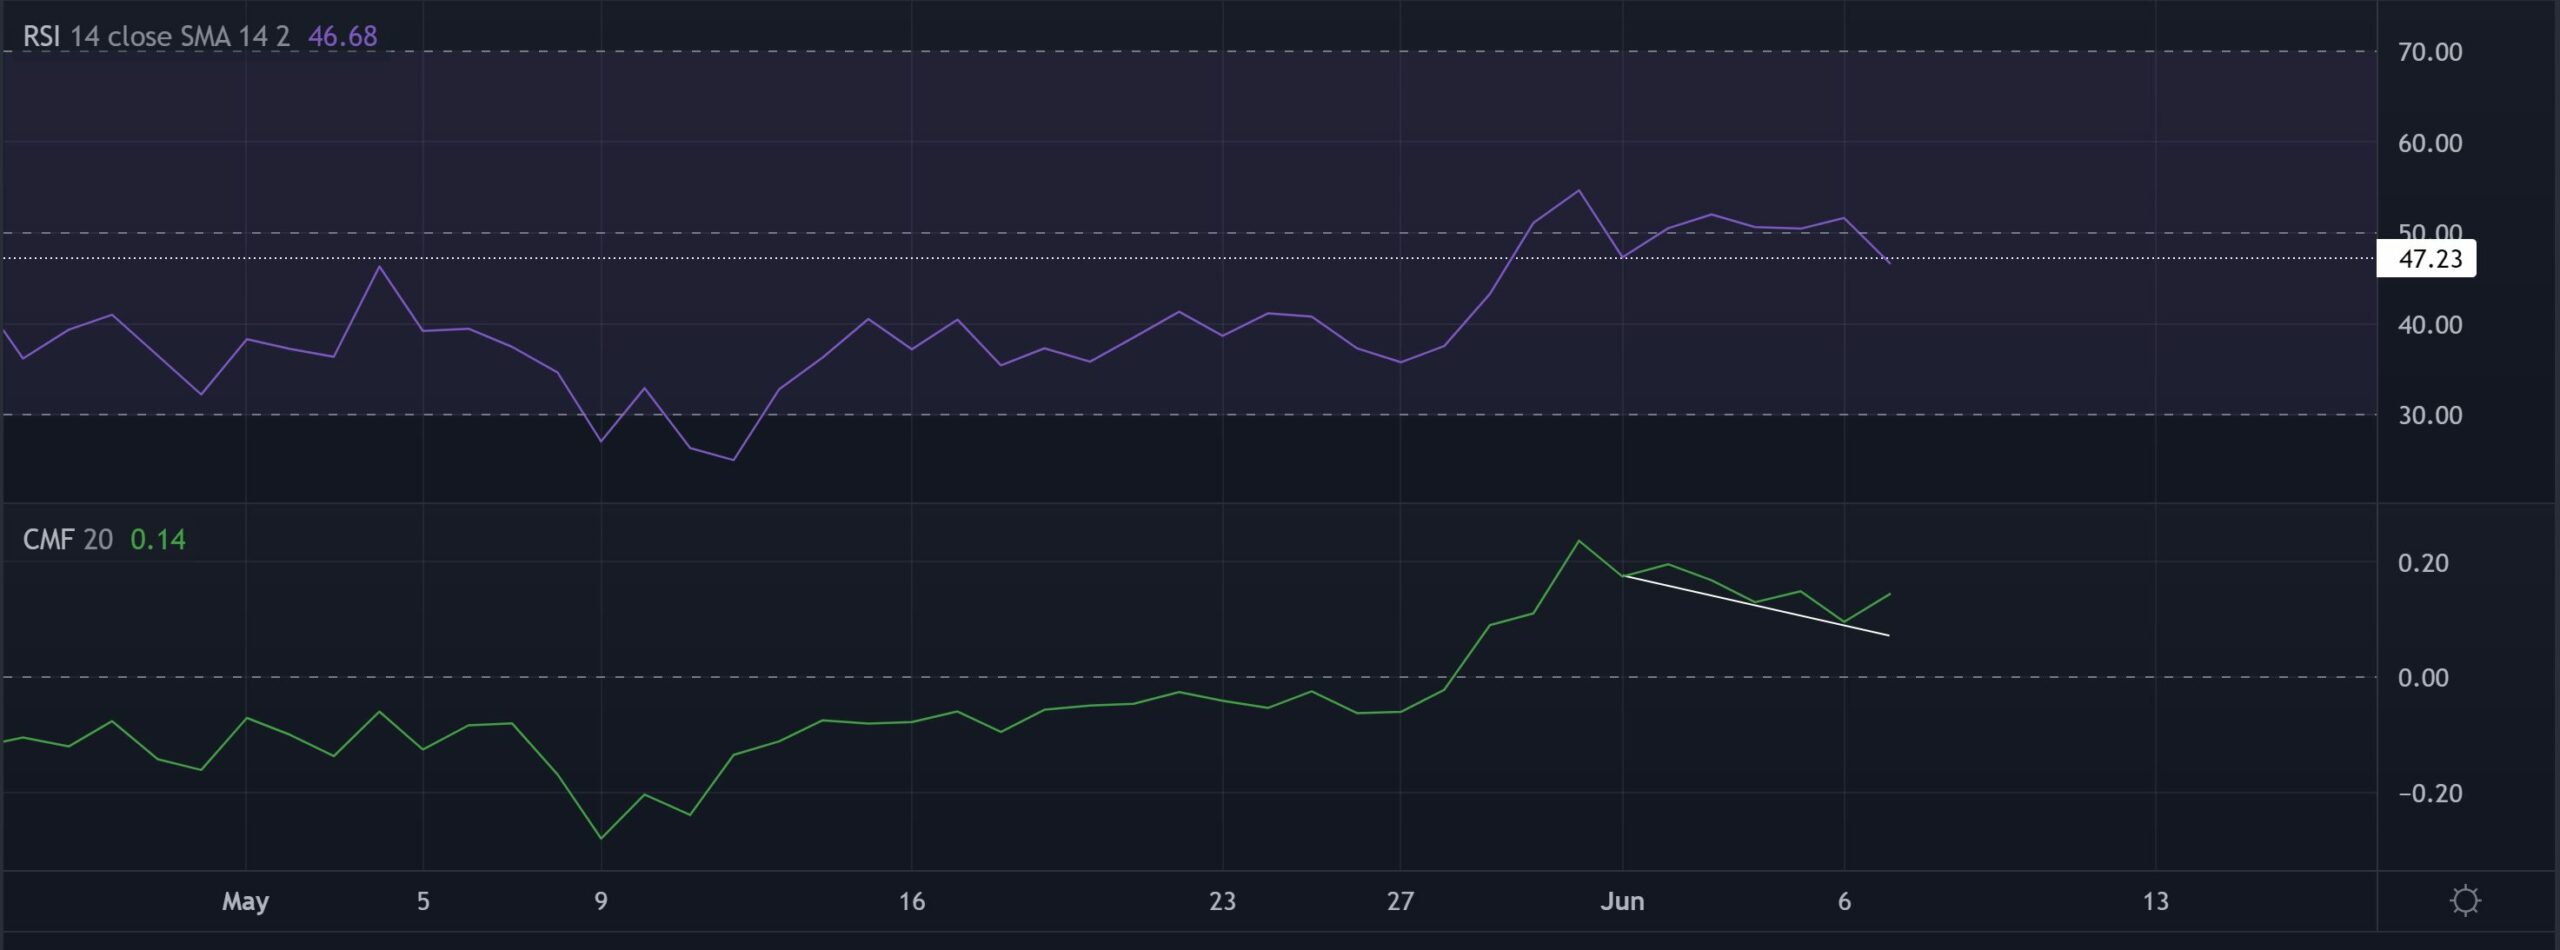
The RSI has taken a rather neutral stance over the last few days. Any close below the 47-support could support the bearish narrative while hampering the revival prospects in the near term.
Over the previous day, the bullish CMF registered lower peaks in the four-hour timeframe. This trajectory bullishly diverged with the north-looking price action troughs.
Conclusion
Considering the convergence between the POC, Basis line of BB, and the lower trendline of the up-channel, XLM could see an immediate bounce-back. In which case, a close above $0.14-resistance would trigger a further upside.
But with the two-month resistance standing sturdy, any close below the pattern could lead to a retest of the $0.12-zone.
Besides, investors/traders should factor in broader market sentiment and on-chain developments to make a profitable move.


