STEPN [GMT] rallies but is demand conspicuously missing

Disclaimer: The findings of the following analysis are the sole opinions of the writer and should not be considered investment advice.
In April, Bitcoin and most of the altcoin market as well were in decline, but GMT rallied from the $2.1 support, as high as $4.17 in late April. However, in the past two weeks, the bullish strength of the token has massively waned.
The price dropped below $1 but was quick to resurface as Bitcoin bulls also pushed the prices to test the $30.2k resistance. Does Bitcoin have some steam left to push further higher, and can STEPN’s token follow?
GMT- 1 Hour Chart
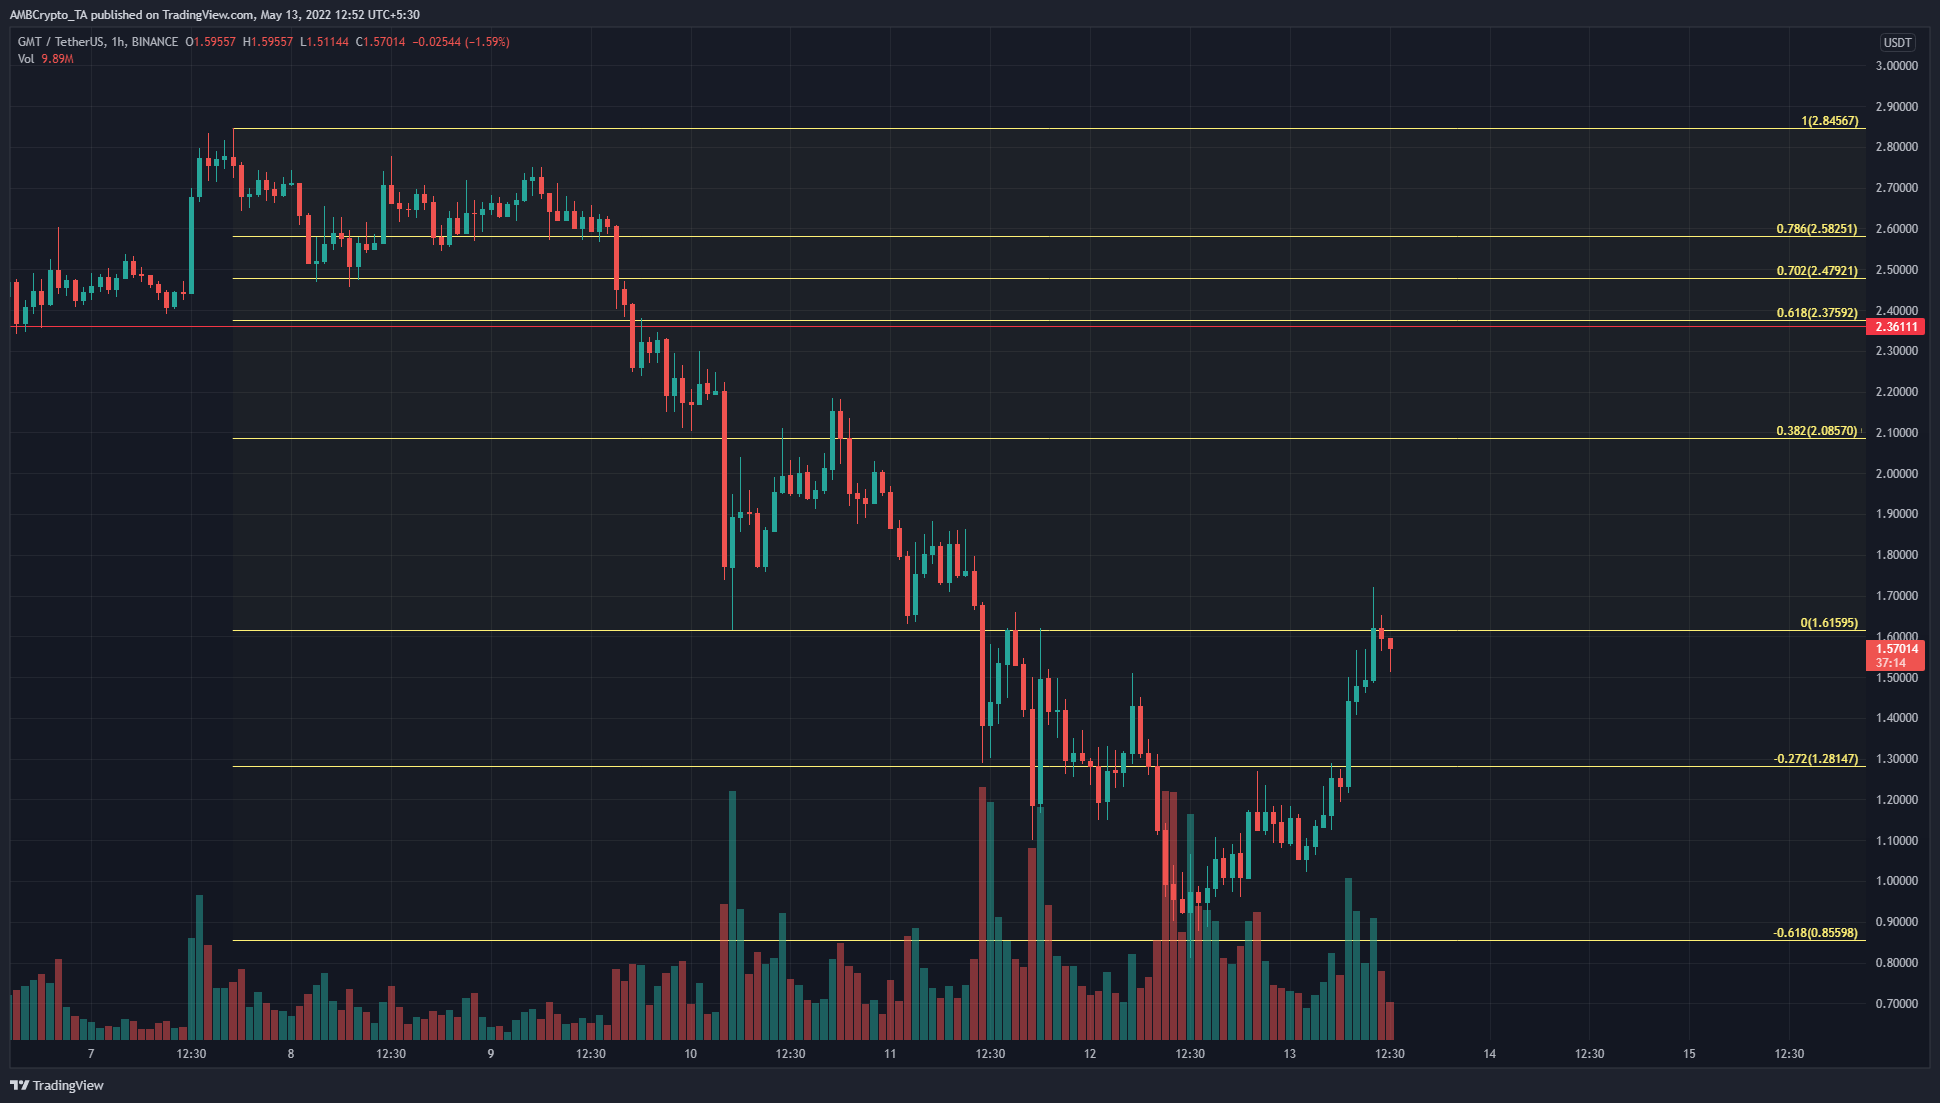
GMT appeared to have found its local bottom, as evidenced by the bulls being able to push the price past the $1.5 mark and the $1.615 level as well. A set of Fibonacci retracement levels was plotted based on GMT’s drop from $2.84 to $1.61 last week.
The 27.2% and 61.8% extension levels of this move have been respected, and at press time the price was knocking on the doors of the $1.61 resistance. Therefore, the near-term bias has shifted from bearish to bullish once more.
Risk and the position size have to be carefully managed as GMT has been quite volatile recently. A retest of the area between $1.5 and $1.28 could offer an opportunity to enter a long position on the asset.
Rationale
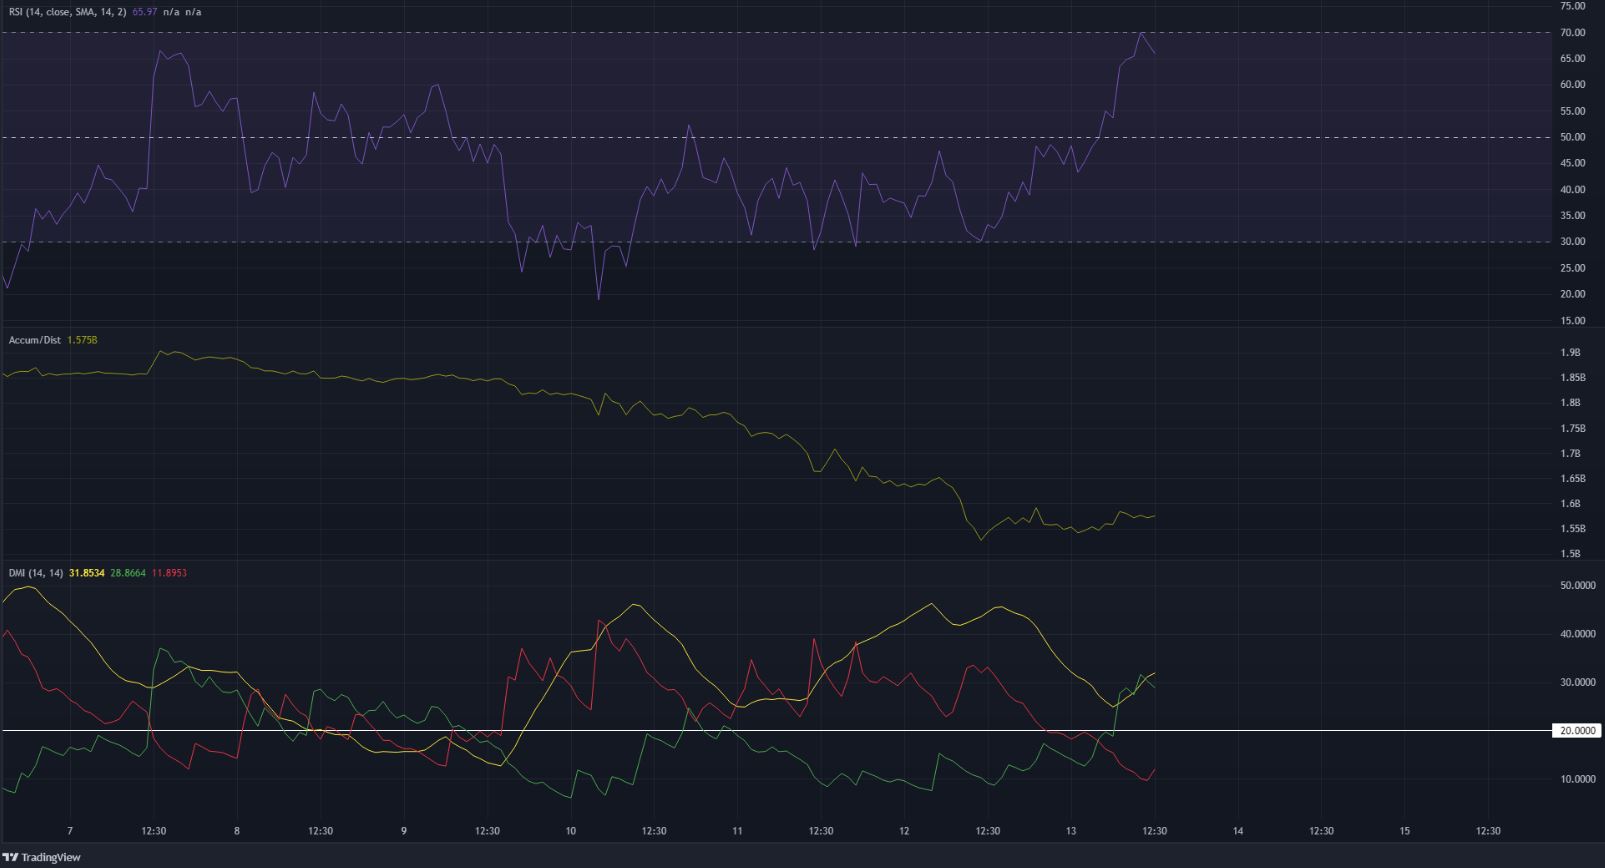
The RSI rose past the neutral 50 mark to indicate the shift in momentum from bearish to bullish. The DMI also showed a shift in trend, as the +DI and the ADX (green and yellow respectively) were well above the 20 mark in recent hours.
On the other hand, the A/D indicator has been falling. Despite the nearly 80% rally that GMT posted in the past few hours, the A/D simply did not see a large move upwards. Therefore, it was possible that these gains could be quickly reversed.
Conclusion
The market conditions are risky, as many crypto assets have a longer-term bearish bias but a near-term bullish bias. GMT was one of them, and it was unclear just how high this rally could reach. However, a session close above $1.6 would mean that GMT has strength enough to push toward the $2 mark.


