Taking stock of Polkadot’s price movement, after it faces stiff resistance at $32.7

Polkadot has retraced back to a logical buy zone on the daily chart. There was also the possibility that Polkadot would slide toward $23 once more, in case Bitcoin was unable to hold on to its near-term range lows.
There have been places on the chart where buyers stepped in, and the price reacted impulsively and bounced from those areas. These are the places where a long-term Polkadot buyer would look to enter.
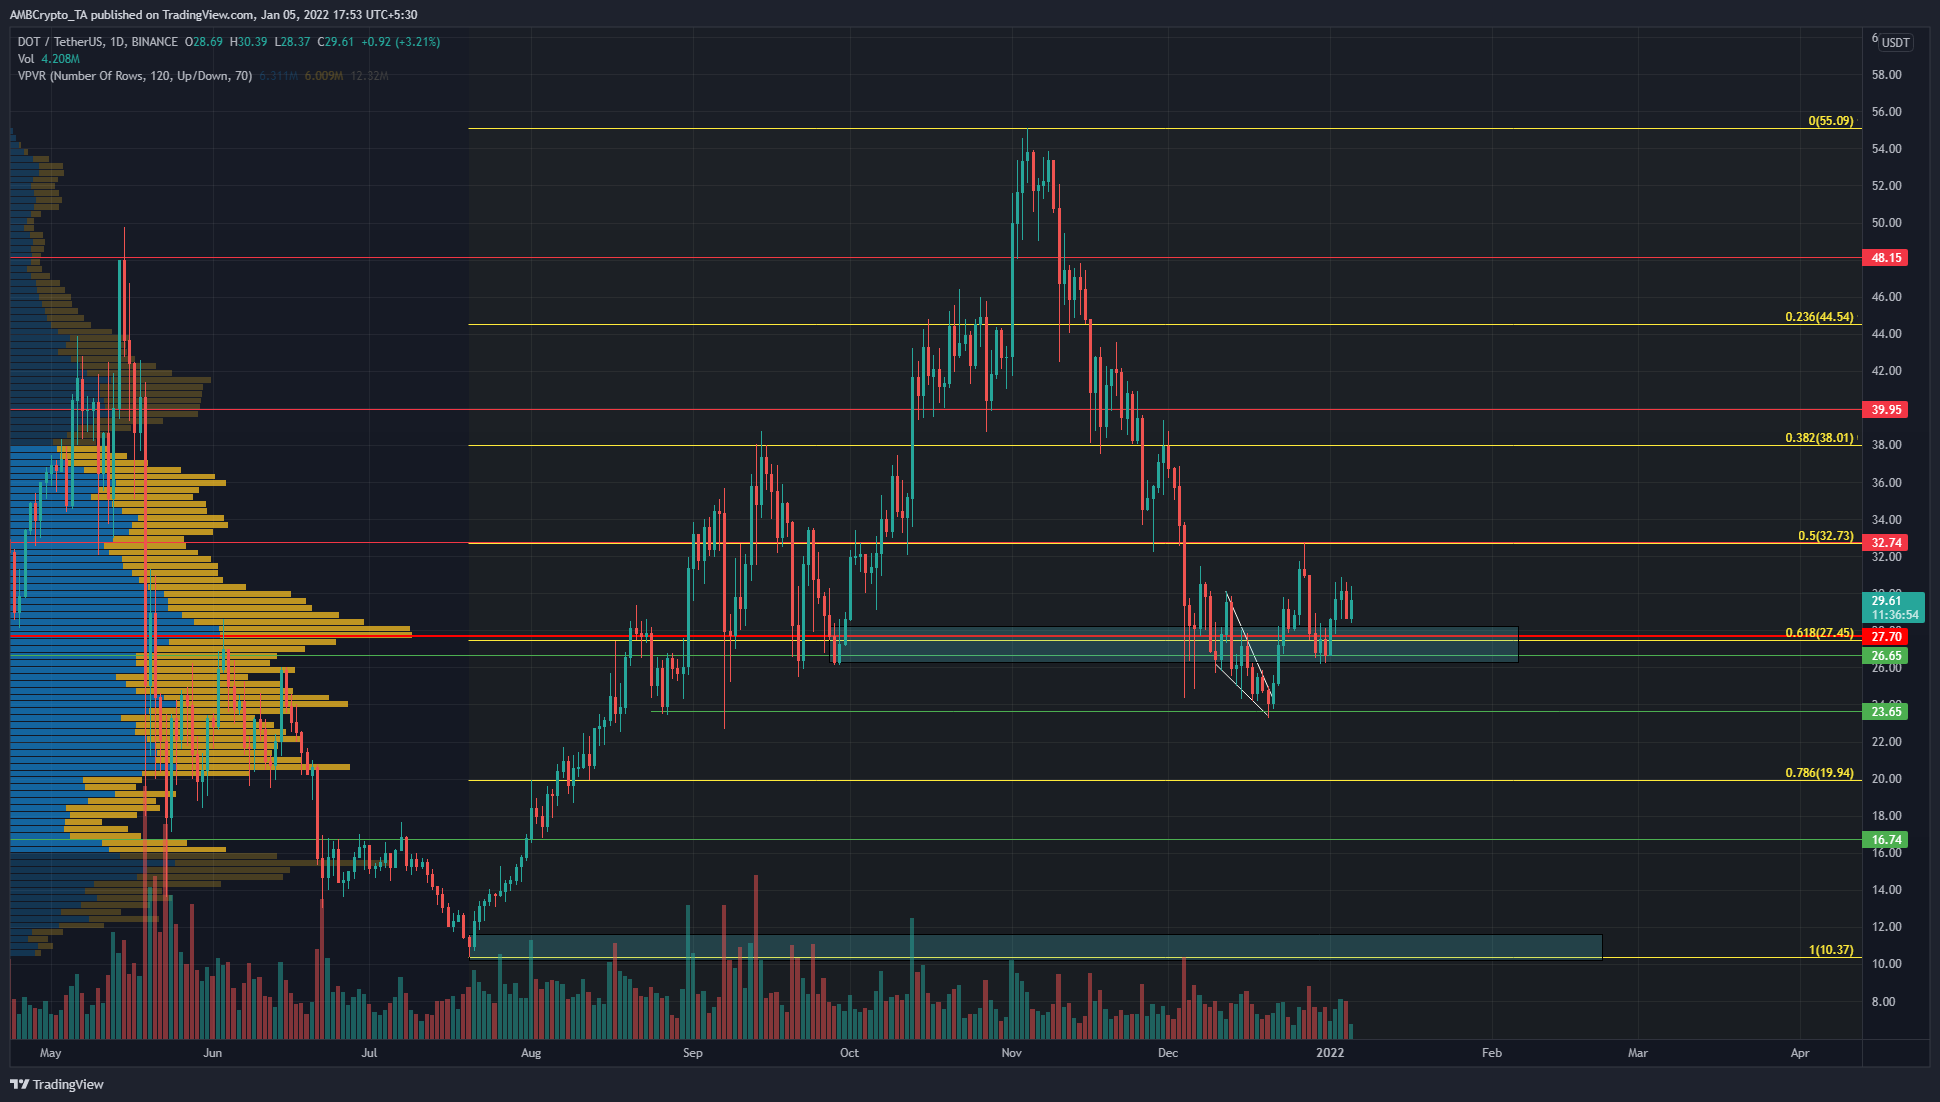
Based on DOT’s move from $10.37 to $55.09, Fibonacci retracement levels were drawn. Some of these levels also coincided with important high-timeframe levels of support and resistance, such as the $27.7 level.
Last month, DOT formed a falling wedge (white) and broke out to climb as high as the $27.45 retracement level, but bulls reverted to take-profit mode and the market flipped from near-term bullish to near-term bearish late in December. This was followed by a retest of the $26.65 support level.
The Visible Range Volume Profile showed the Point of Control to be at $27.7, which had confluence with the horizontal support (green- $26.65) as well as a retracement level (yellow) at $27.45.
Hence, a daily close below this cluster will likely see DOT dip to $23.65 once more, and possibly as deep as $19.94.
Rationale
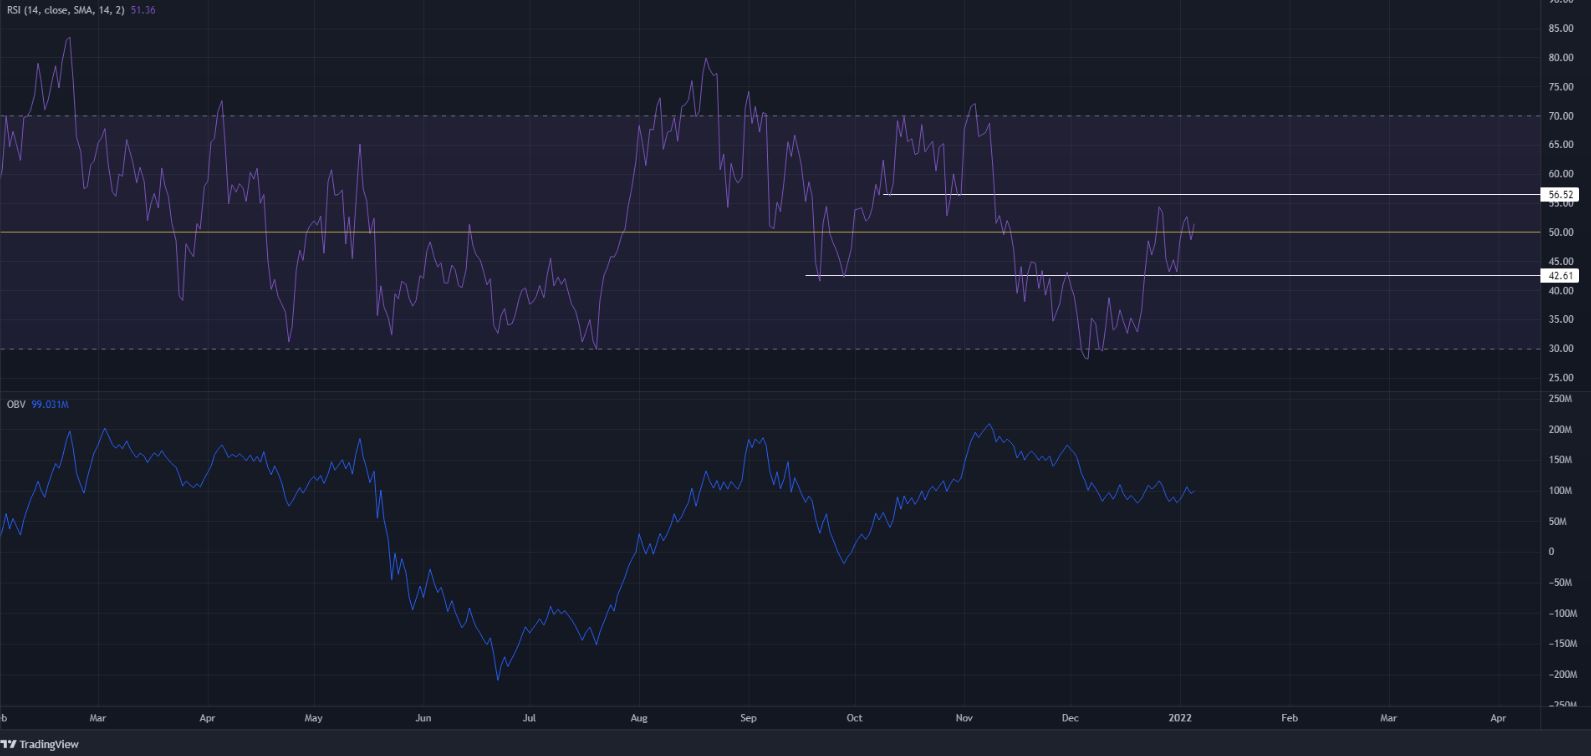
The RSI tread water at the neutral 50 mark, with the 42.6 area being a place where it had recently bounced from. In the past, a drop below this level has seen DOT extend its losses. Similarly to the upside lay the 56.5 level, past which DOT’s bullish momentum can be considered quite strong and the likelihood of another leg upward was high.
While the RSI showed momentum was neutral, the OBV had registered lower highs over the past two months and set higher lows extending all the way back to July. The OBV has been moving sideways over the past few days and indicated a possible accumulation phase ongoing.
Conclusion
Momentum was neutral and buy-sell volume has been in balance over the past few days as Polkadot approached a significant area of support. Hence, a dip to $27.45 can be bought but has to be monitored closely to see if the price closes below this level, in which case a retest of the same level can be sold.
The 61.8%-78.6% retracement area is generally where a trend is most likely to stall or reverse, and DOT has already visited this area once and formed a higher low since then.