
Tezos broke above an ascending triangle and touched $6.7 before moving towards a region of support. Waves awaited additional sessions for a breakout confirmation, while Decred was on the verge of moving below its up channel.
Tezos [XTZ]
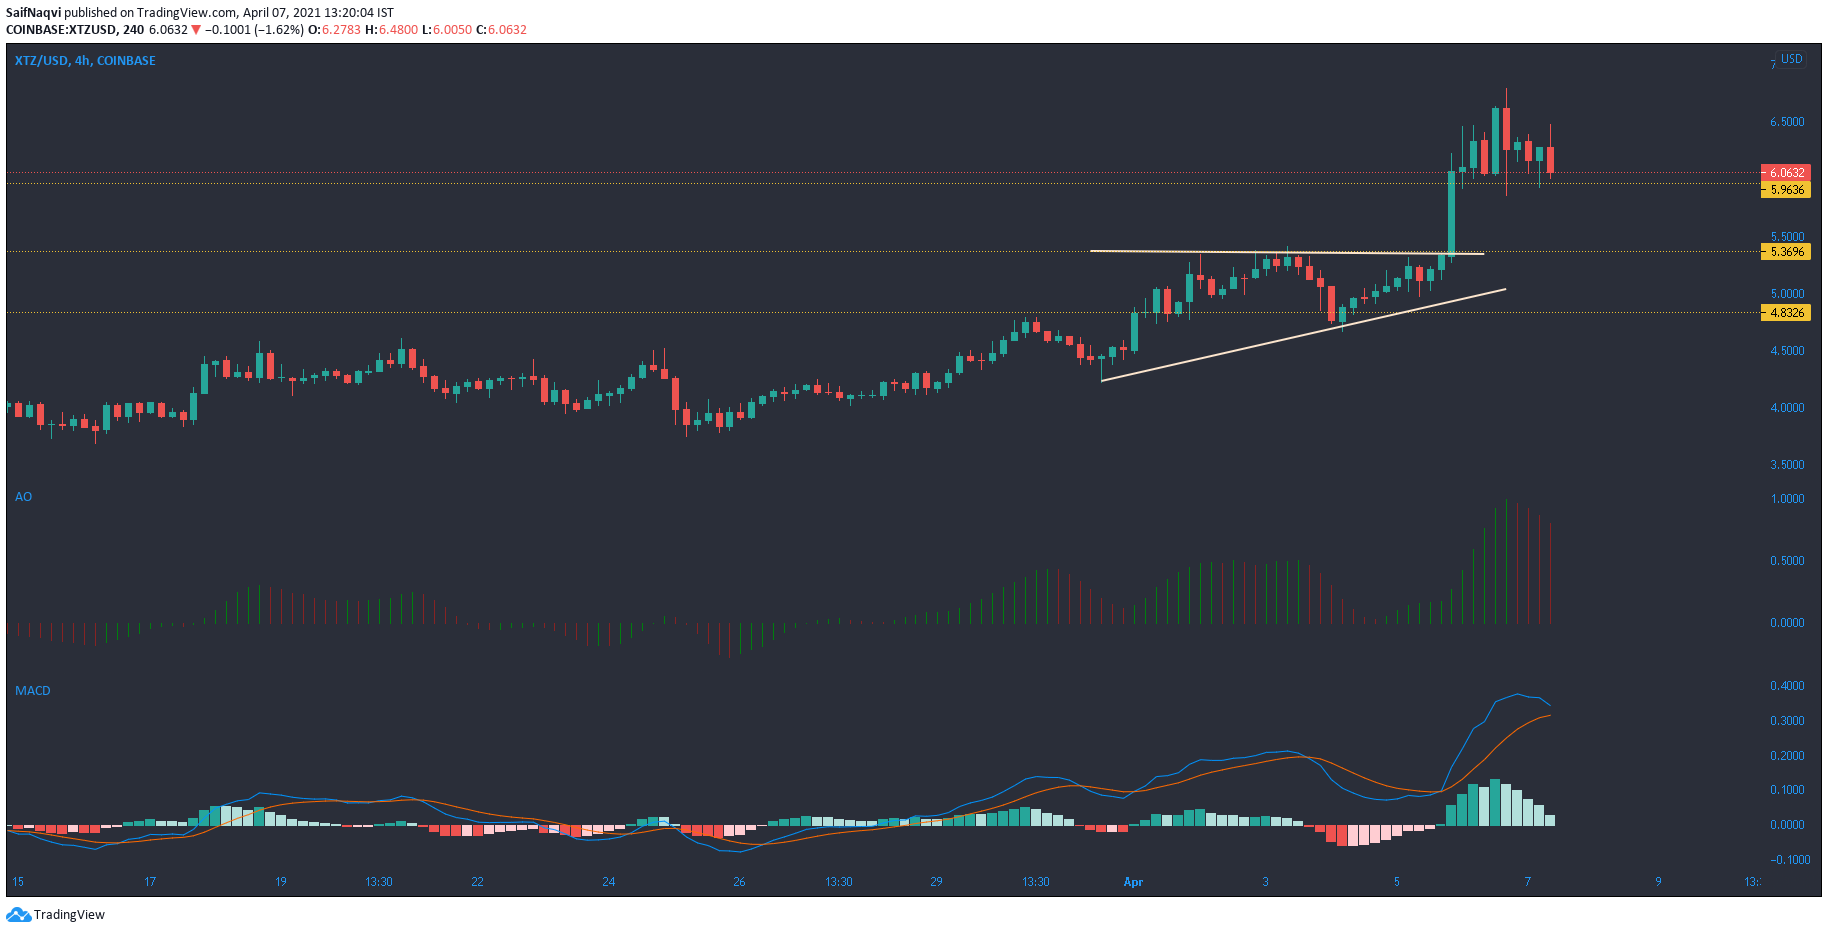
Source: XTZ/USD, TradingView
On the 4-hour timeframe, a breakout was spotted from an ascending triangle, one that pushed Tezos to a high of $6.7 before the price moved south. Some support was available between $5.8-$6, but a dip below this level was likely considering the present position of its indicators. The MACD closed in on a bearish crossover, while the Awesome Oscillator noted momentum on the bearish side.
If a breakdown does take place, the $5.3-level would be in focus over the next few sessions, although the buyers were tipped to defend this region from an extended sell-off.
Waves [WAVES]
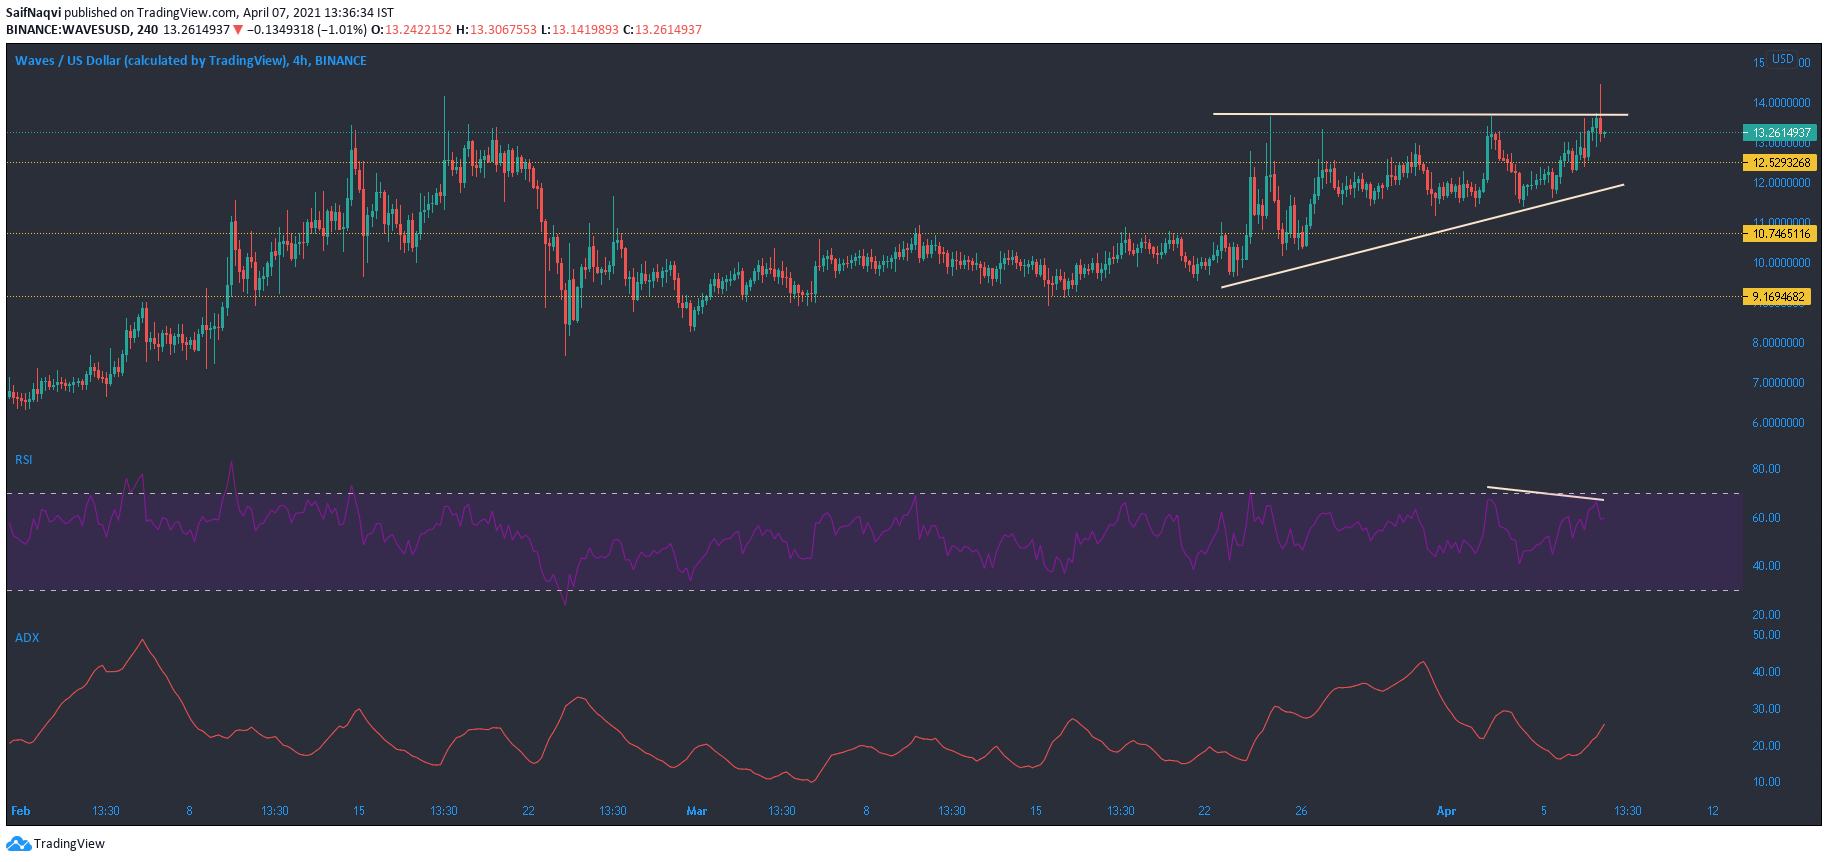
Source: WAVES/USD, TradingView
While a single candlewick did breach the upper trendline on Waves’ charts, the next few sessions would provide more clarity with respect to a breakout. The ADX pointed north from 24 as a strong trend was in the making. A successful breakout could push the price towards $15 or even $15.5, but there were contrasting indications in the market.
This came from a southbound RSI, one which reversed direction before reaching the overbought zone. A bit of divergence was also spotted on the index after it made lower highs. The 24-hour trading volume did pick up at the time of writing, but more trades need to be accumulated for sharper movements.
Decred [DCR]
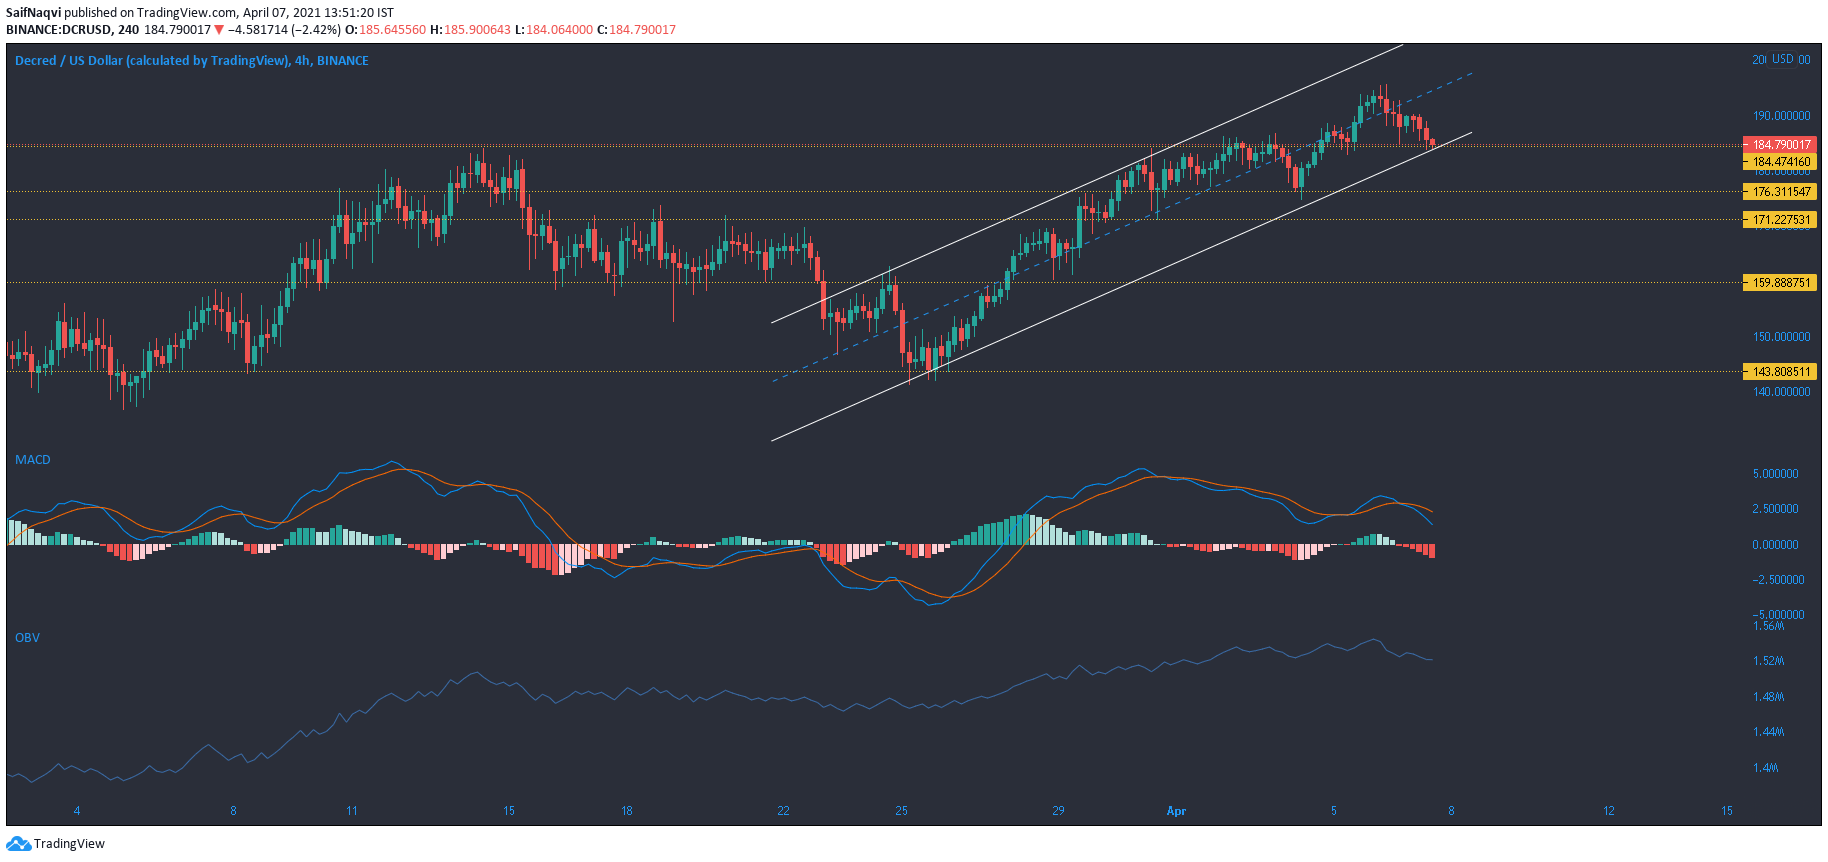
Source: DCR/USD, TradingView
Since a bounce back from the $143.8-support, Decred maintained its up channel as the price closed in on the $200-mark. However, this pattern usually sees a breakdown, and the coming sessions should be observed carefully to spot a move below the bottom trendline.
The MACD line maintained its movement below the Signal line and the histogram noted rising bearish momentum. The OBV trended lower as selling pressure outmatched buying pressure. Short positions can be opened when a candlestick closes below the lower trendline, but traders must await confirmation before locking in their positions. In case of a fall, support levels resided at $176.31 and $171.2.


![3 catalysts that could send Ethereum [ETH] to $5,000 in 2025](https://ambcrypto.com/wp-content/uploads/2025/05/Abdul_20250515_122605_0000-400x240.webp)