The conditions for Ethereum Classic having a bullish bias include…

Disclaimer: The findings of the following analysis are the sole opinions of the writer and should not be considered investment advice
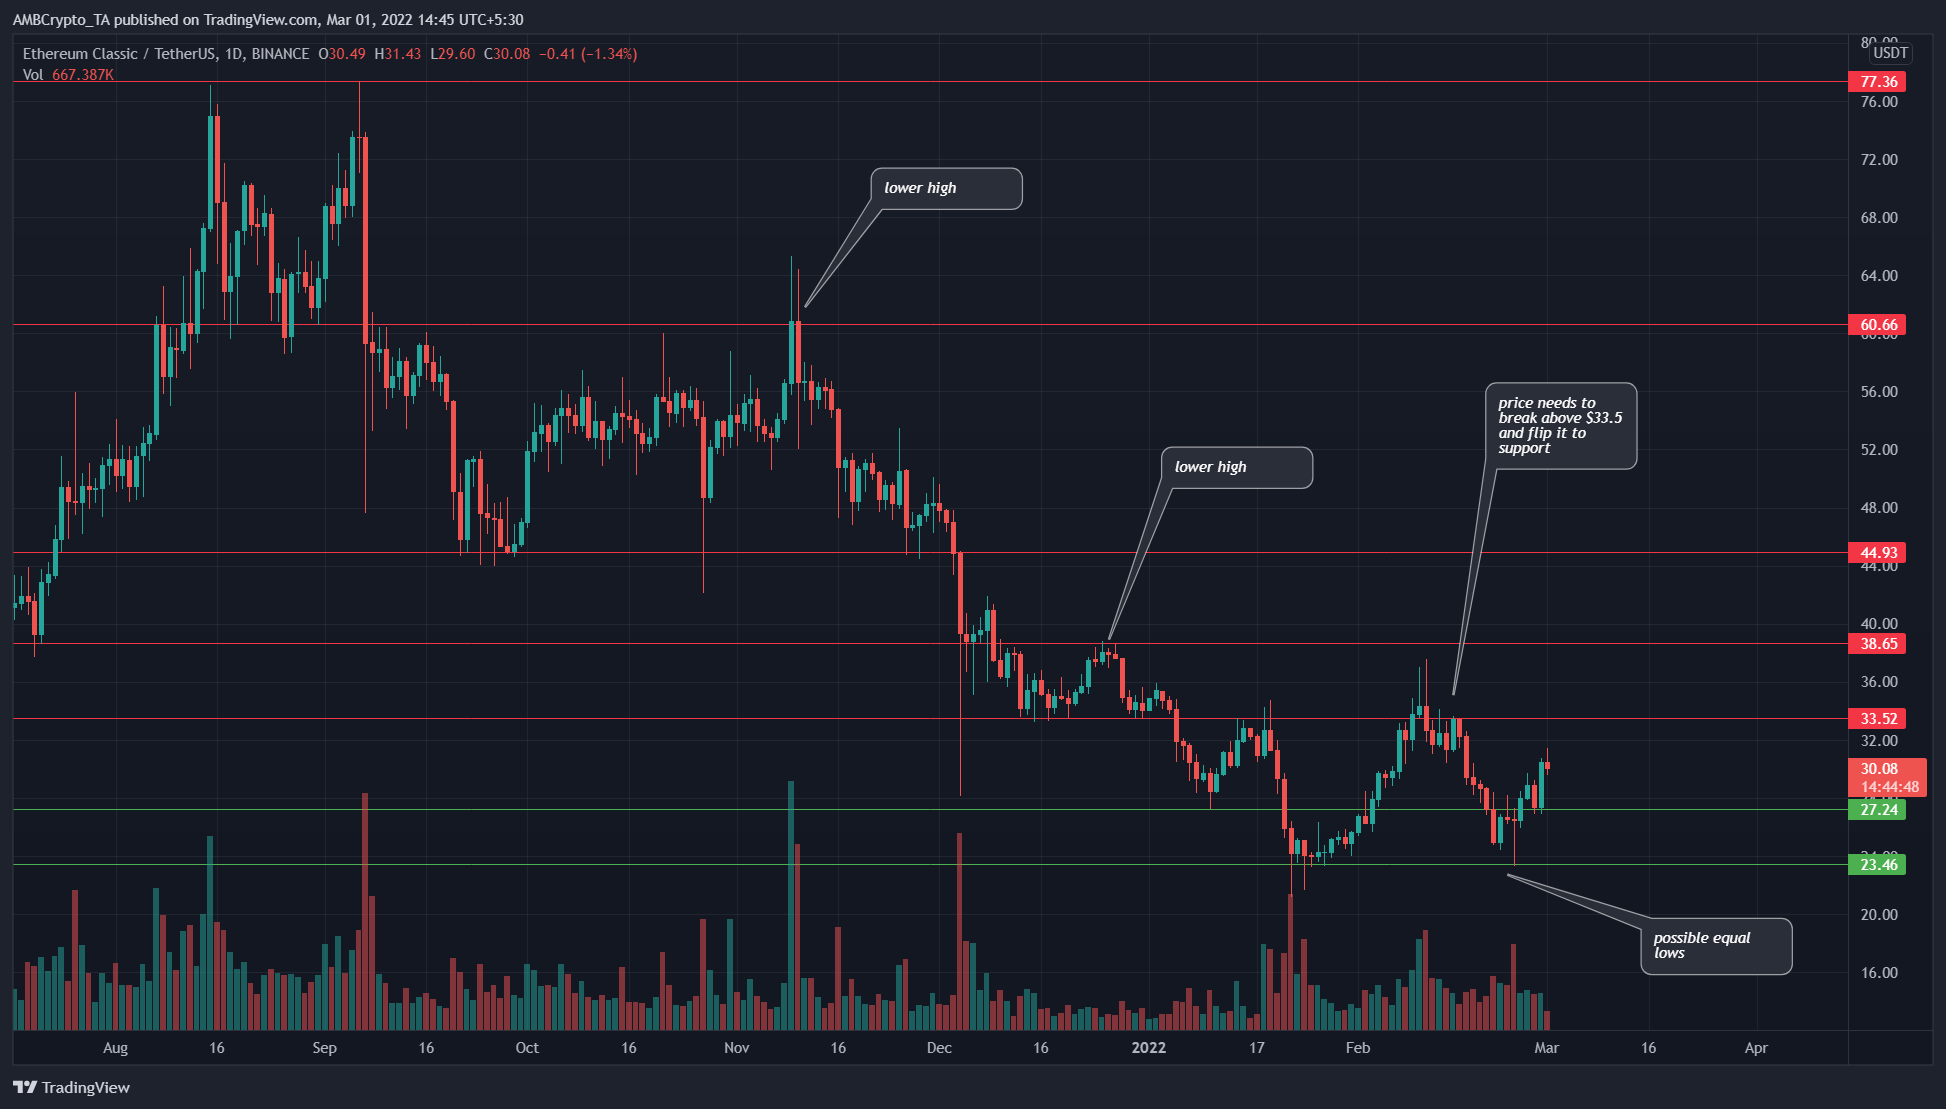
In November, Ethereum Classic faced rejection at $60.6 and has since been on a downtrend. More recently it has faced resistance at $38.65 and at $34 as well. On the other hand, demand was seen at $23.5 in the past two months. Was this a sign of equal lows for Ethereum Classic, or was this a temporary respite before further downside?
ETC- 1 day chart
On lower timeframes, Bitcoin has shown signs of bullishness. This could see ETC and the wider crypto market move upward on a short-term basis. But the longer-term outlook leaned toward the bearish side.
This was because the market structure was bearish and unbroken. Moreover, while demand has appeared at key support levels, it was not the kind of demand for ETC that would indicate a shift in bias on the longer-term outlook.
Rather, the demand appeared to be only short-term, before profits were taken and market participants flipped bias toward bearish after a decent bounce.
At the time of writing, the price has bounced from $27.24, but unless the previous lower high at $34.4 can be taken out, risk-averse investors would not consider ETC a buying opportunity.
Rationale
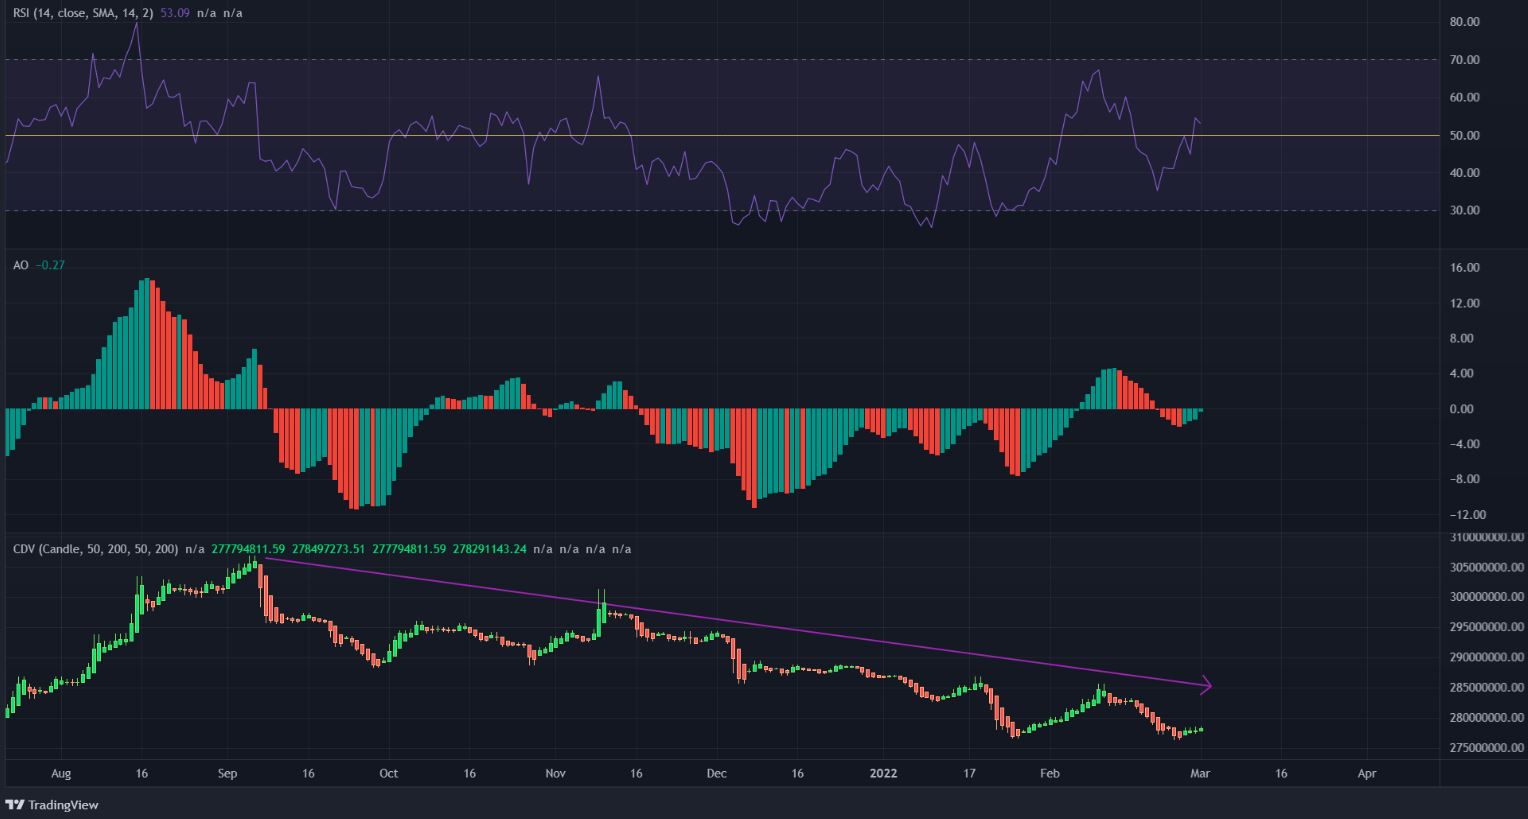
The RSI oscillated from the neighborhood of the 35 value to 70 and back toward 35 in the past few weeks. At the same time, ETC formed equal highs at the $34 resistance area and bounced from $23.5. This suggested that ETC exhibited characteristics of a range.
If we follow this notion, then the $27.3-$28.6 area becomes an important support level for ETC to hold on to.
The Awesome Oscillator was near the zero line at press time and has been predominantly beneath the zero line in a bearish trend since mid-November.
The CDV indicator has also been on a steady downtrend to show that selling volume was far greater than buying volume.
Conclusion
The $27.3-$28.6 area will likely be an important support zone in the weeks to come, alongside the $23.5 level. To the north, the $34-area needs to be flipped to support before ETC can be considered to have a bullish bias.