The dip that shook the market and what lies ahead, as Bitcoin crosses $50,000

Bitcoin dropped by almost 20% over the weekend, falling down to a three-month low of $46.5k amid a market-wide flash crash. The choppy price action gave way to panic sell-offs and weak-hand capitulation. On the other hand, ‘buy the dip’ chants took over crypto Twitter.
At the time of writing, Bitcoin finally seemed to recover, making its way back to $50.1K, noting over 6% daily gains. However, the question is, can this recovery sustain?
Tricky price movements
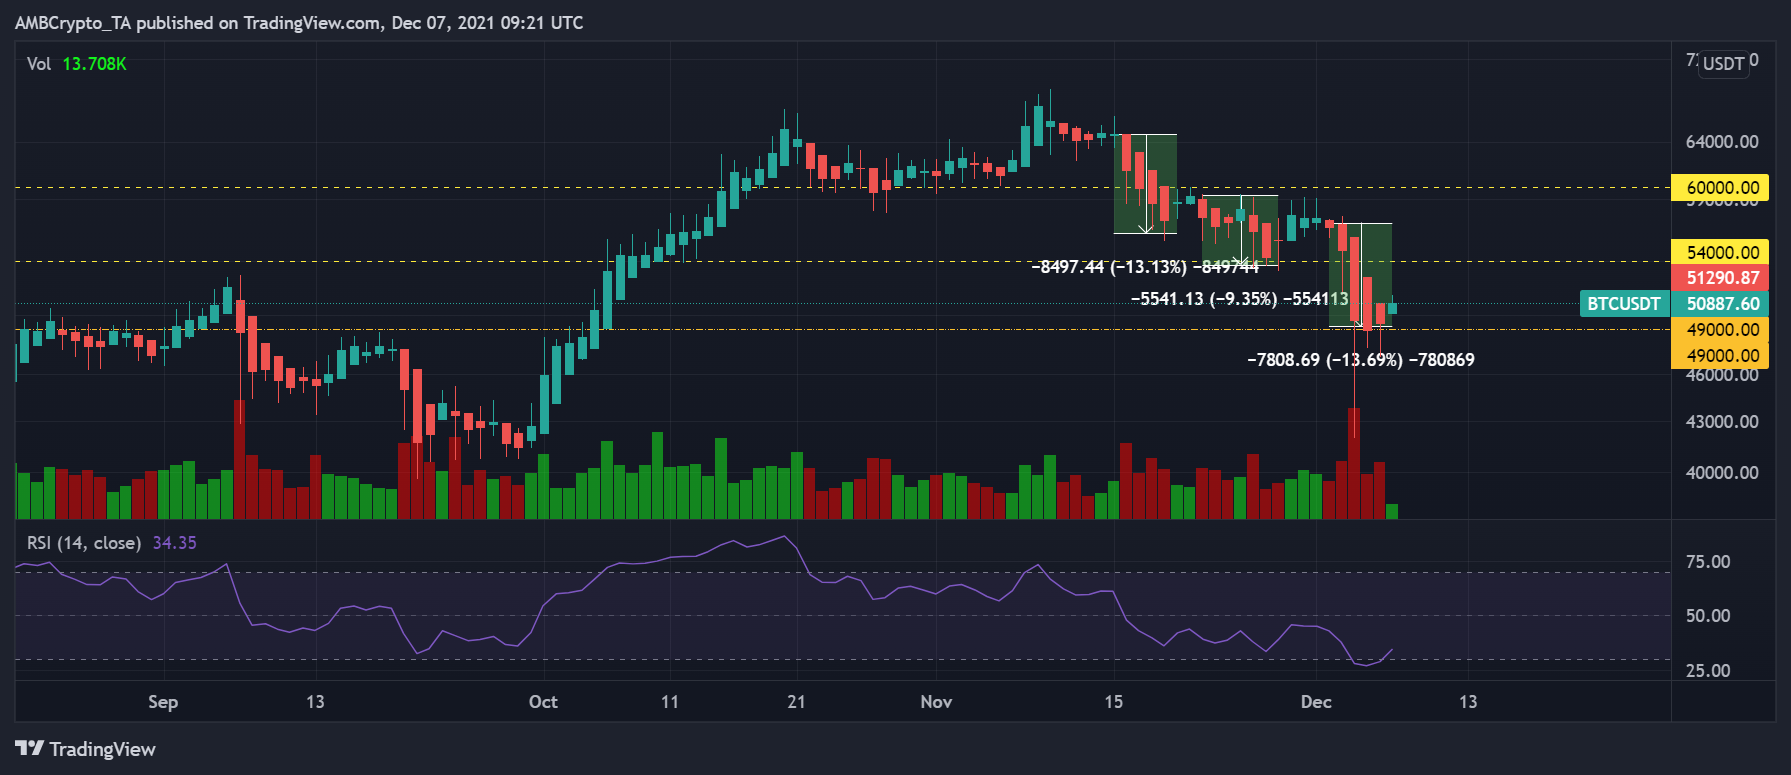
For most of November, Bitcoin made lower lows as its price fell by almost 27% from the all-time high of $69,000. Bitcoin’s November trajectory highlighted how after each dip, a small price uptick or rather consolidation, was noted which was then followed by a bigger dip.
Bitcoin’s price dipped by almost 13% starting 16 November, then close to 9% since 22 November. It was followed by the major flash crash of 3 December, pulling the price down below the $50K level. This price trajectory makes the recent 6% gains, at the time of writing, questionable as to whether this recovery would indeed be a breakout or yet another fake-out.
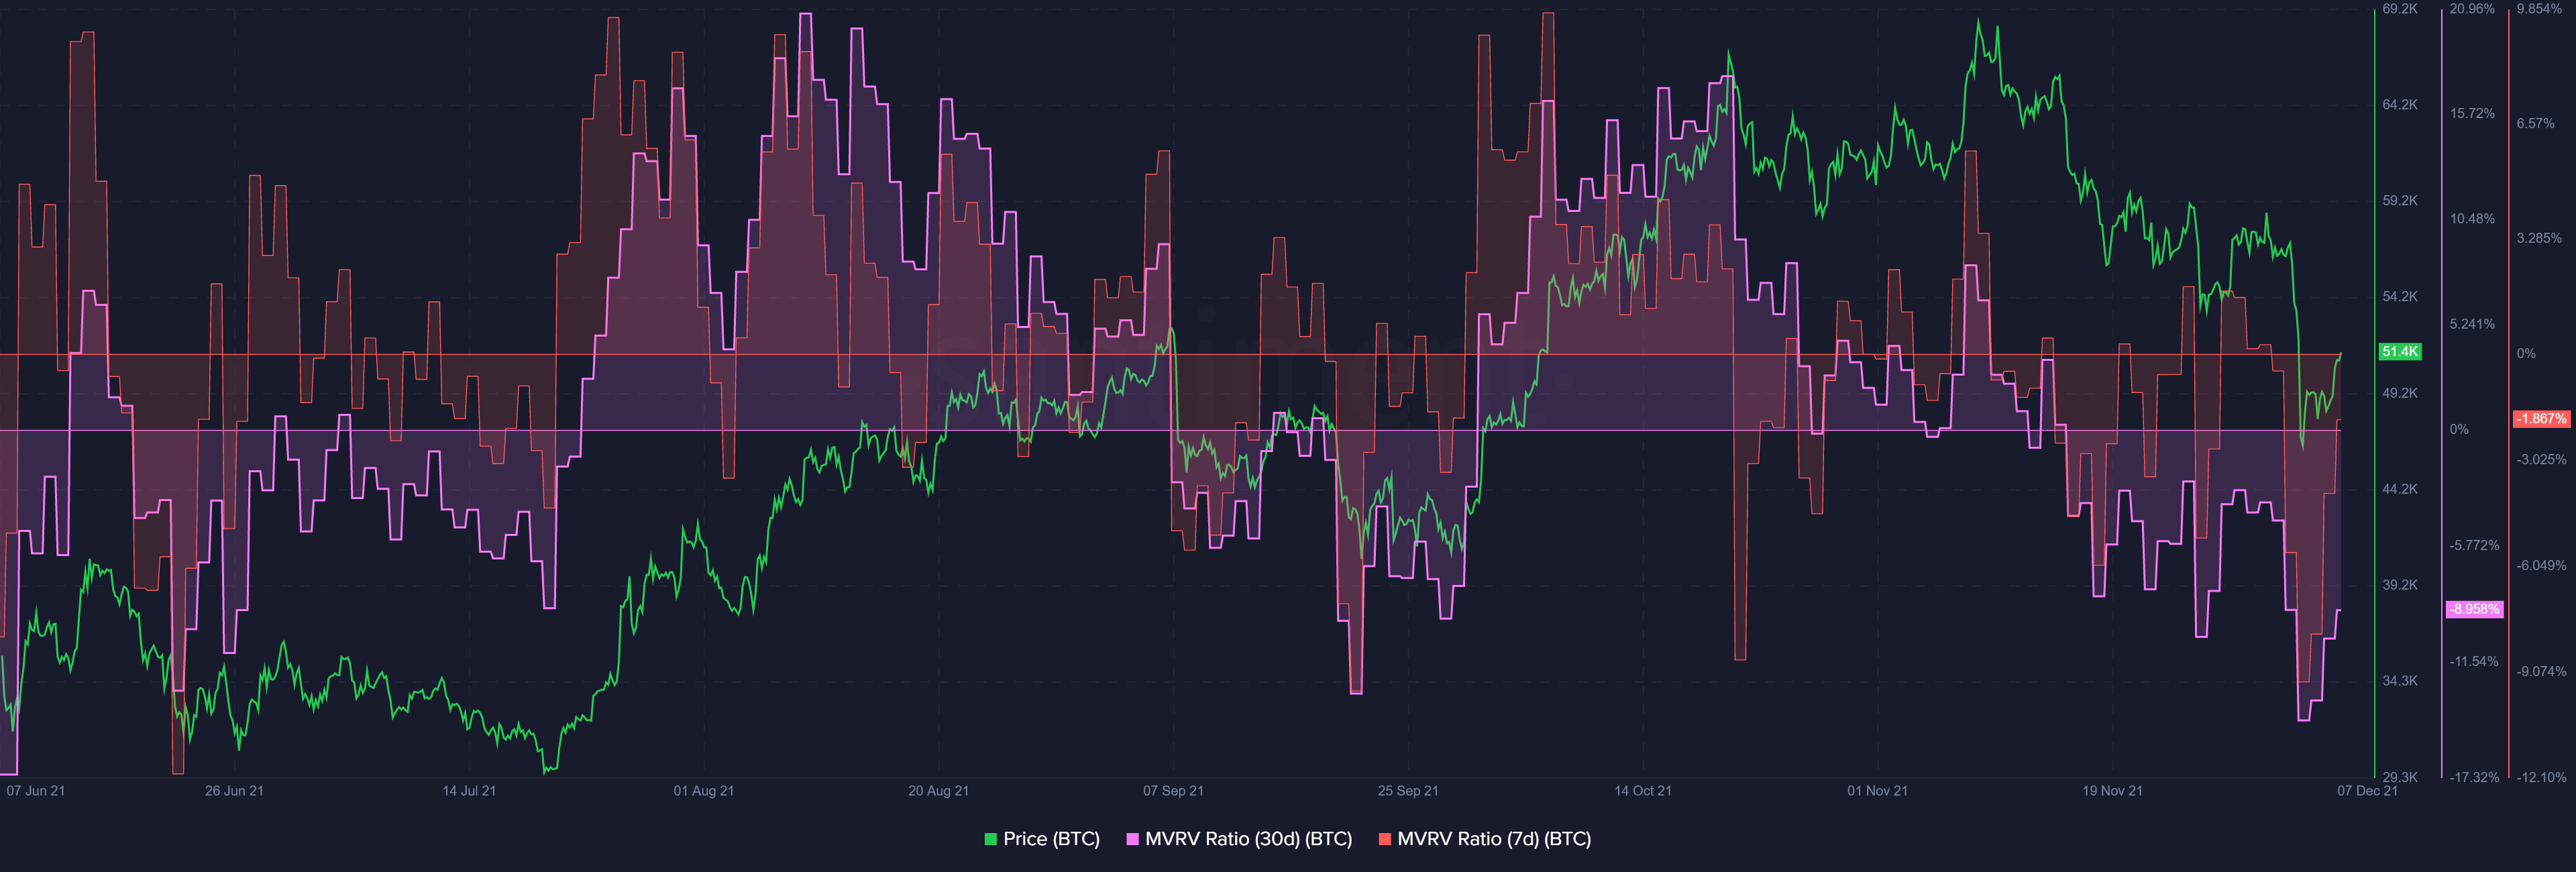
The latest drawdown seemed to impact Bitcoin’s MVRV too, as the 30-day MVRV ratio sat at -8%. Thus, suggesting that the average loss of all addresses that have acquired BTC in the previous month was around 8%. Over the weekend, Bitcoin’s short-term MVRV slumped as low as -19.4% before rebounding.
While its 7-day MVRV quickly picked up as price recovered, Bitcoin’s 365-day MVRV was still away from the ‘bounce-back zone,’ allowing for further correction from a macro perspective. That said, there were certain upsides to the recent fall.
Accumulation continued
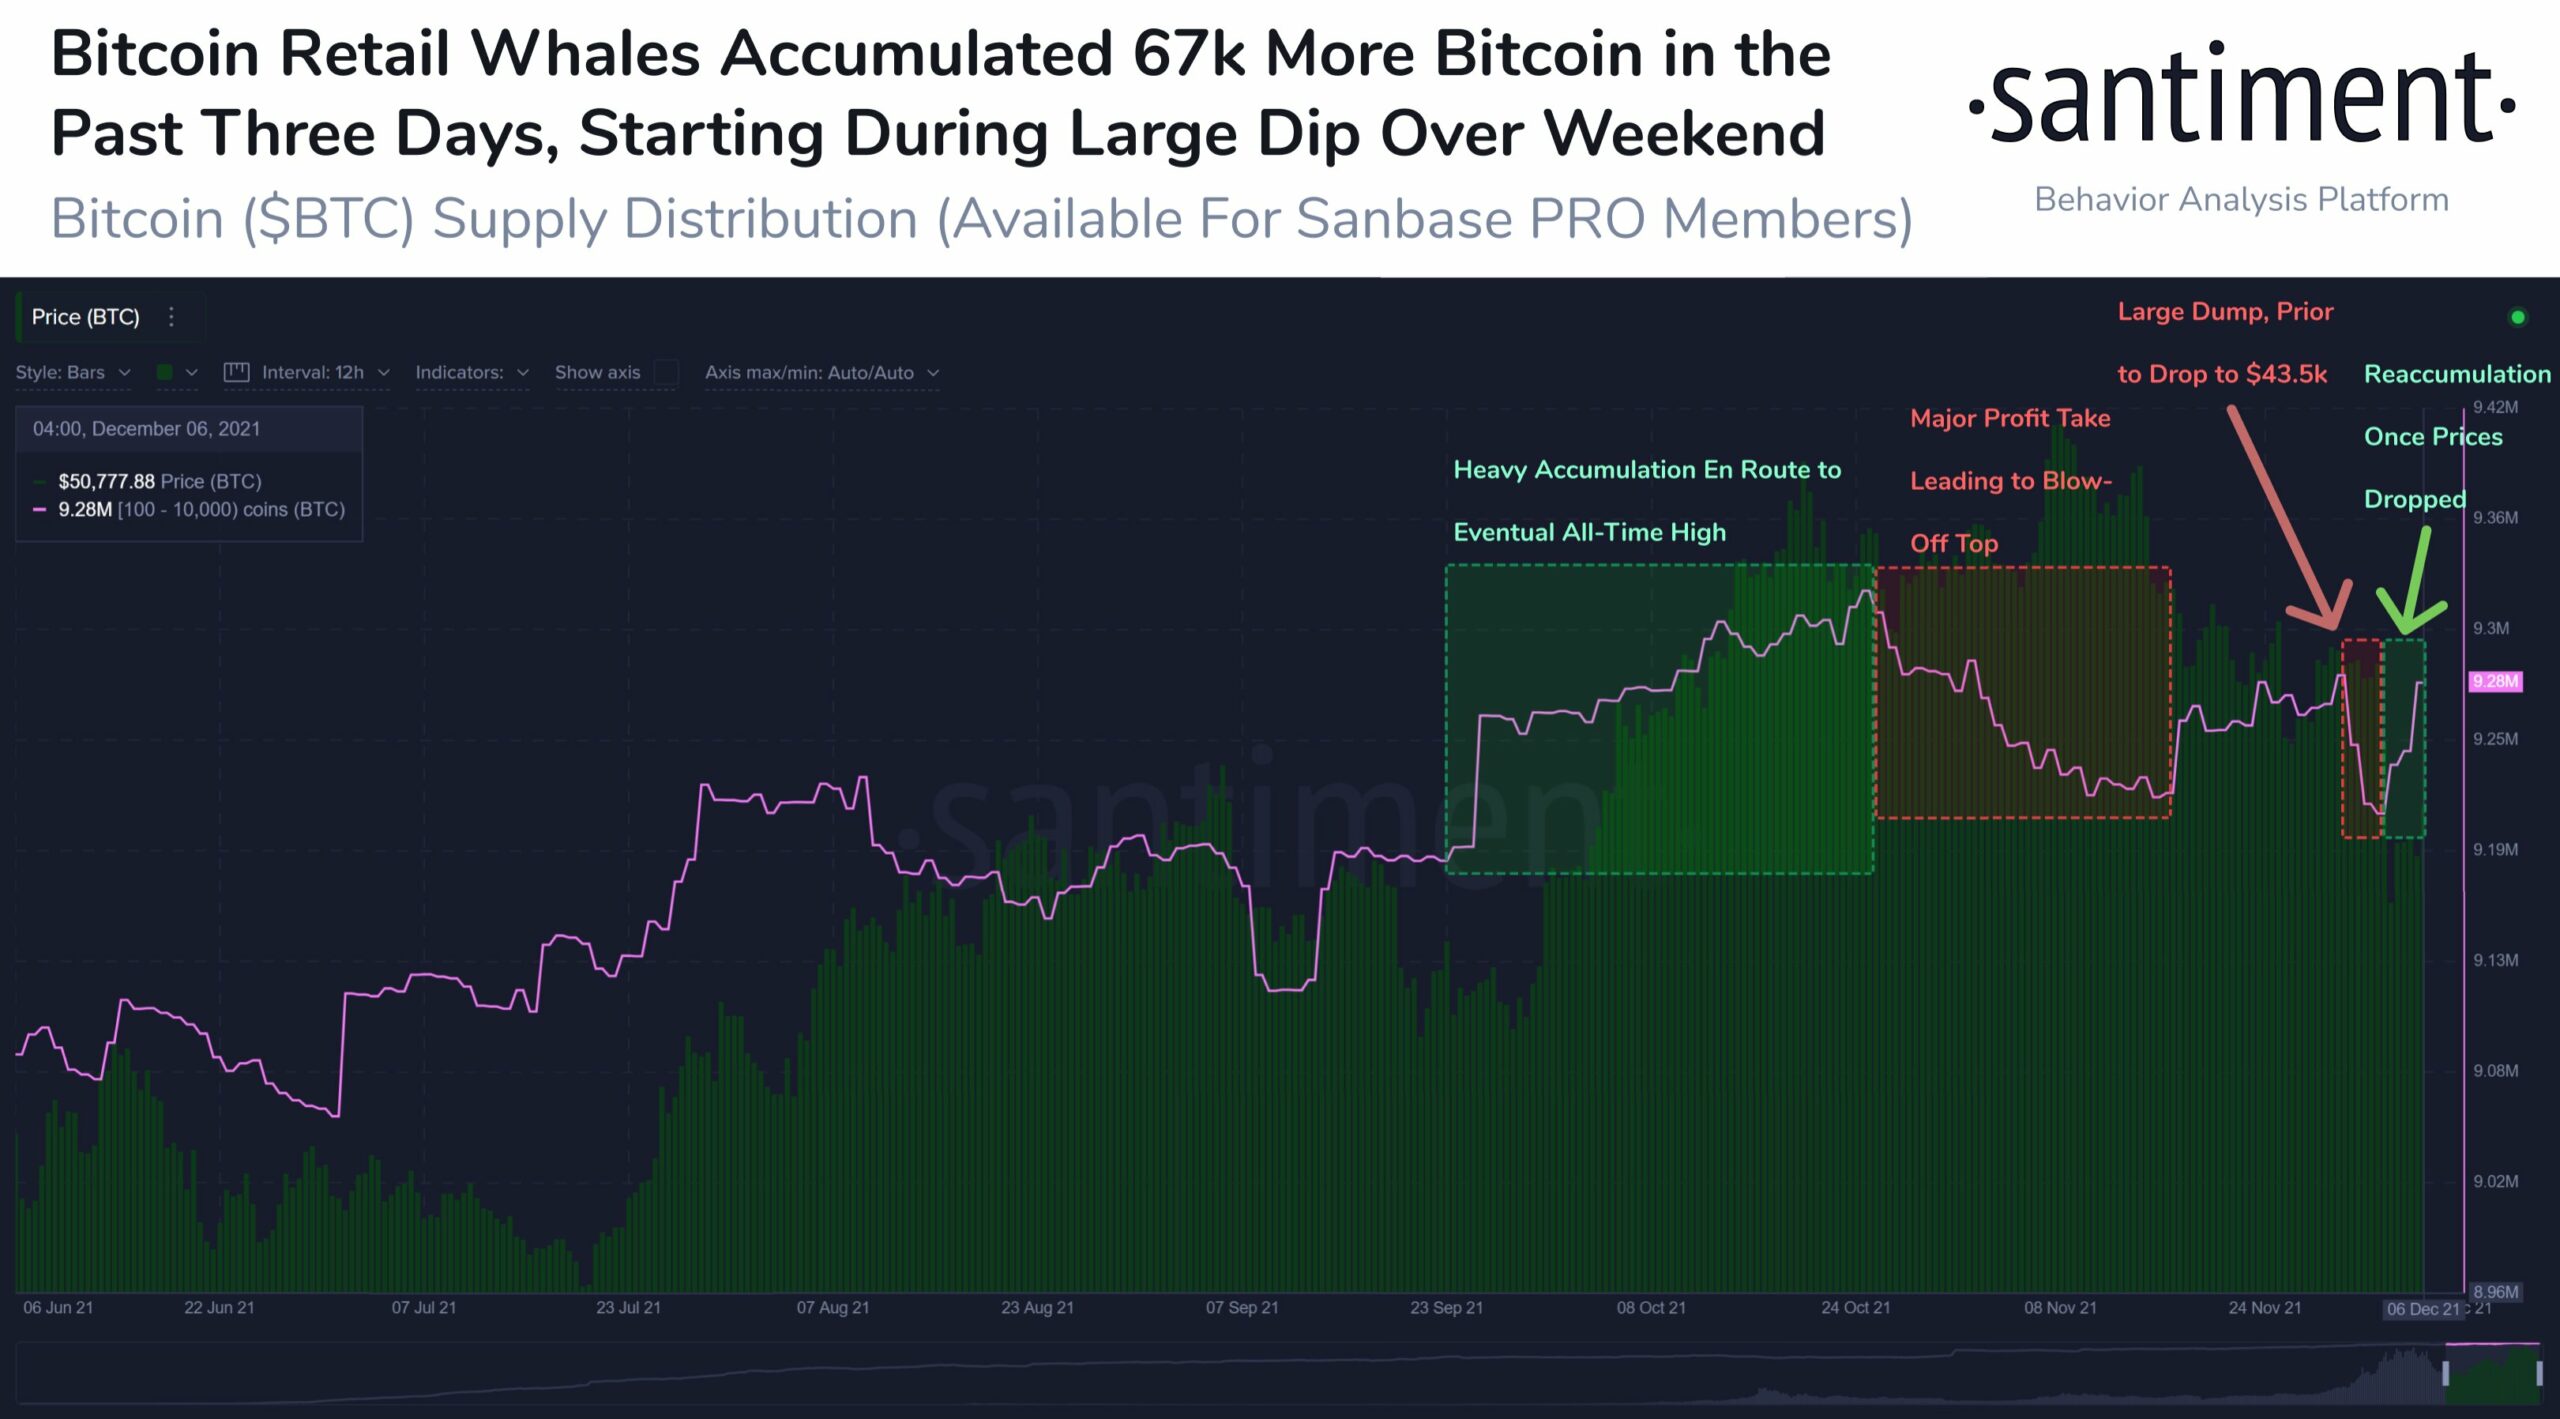
Beginning during the dump to $43.5K addresses holding 100-10K BTC have accumulated over 67K more BTC after dumping the same amount before the price drop. This highlighted how whale traders played the dip to perfection.

Source: Sanbase
However, the crucial question still remained – was a true recovery underway, or will another dip will follow. Well, for one, on-chain metrics and supply dynamics for BTC were different this time.
Back in April, the dip happened with an increase in exchange inflows, which meant that when the correction happened there was already a net positive influx of coins going towards exchange wallets. However now, the situation is different, as so far on a 30 days basis we could still see historically large exchange outflows.

Source: Ecoinometrics
Further, in April/May the accumulation trend risk was in the red. Primarily, because most of the address groups had been distributing coins for a while as opposed to now when the trend is high but it is because most of the address groups have been seeing some sideways action.
Thus, while the overall trend instills some optimism it’ll be best to stay cautious until Bitcoin is above the $54K mark. BTC’s price trajectory in the mid-short term could also be impacted by external factors. One of them being, the next U.S. inflation data release on 10 December and the 14 December Federal Reserve policy meeting.


