The ifs and buts of Fantom’s near-term price action

Disclaimer: The findings of the following analysis are the sole opinions of the writer and should not be considered investment advice.
Over the past week, the trend for Fantom, which had been strongly bullish, shifted to a bearish bias as it fell from $2.4 to $1.81.
The winds now appear to have changed once again, this time in favor of the bulls. For traders or investors with a very short time horizon, Fantom has climbed above an interesting resistance level. This may offer an interesting buying opportunity.
FTM- 1 hour chart
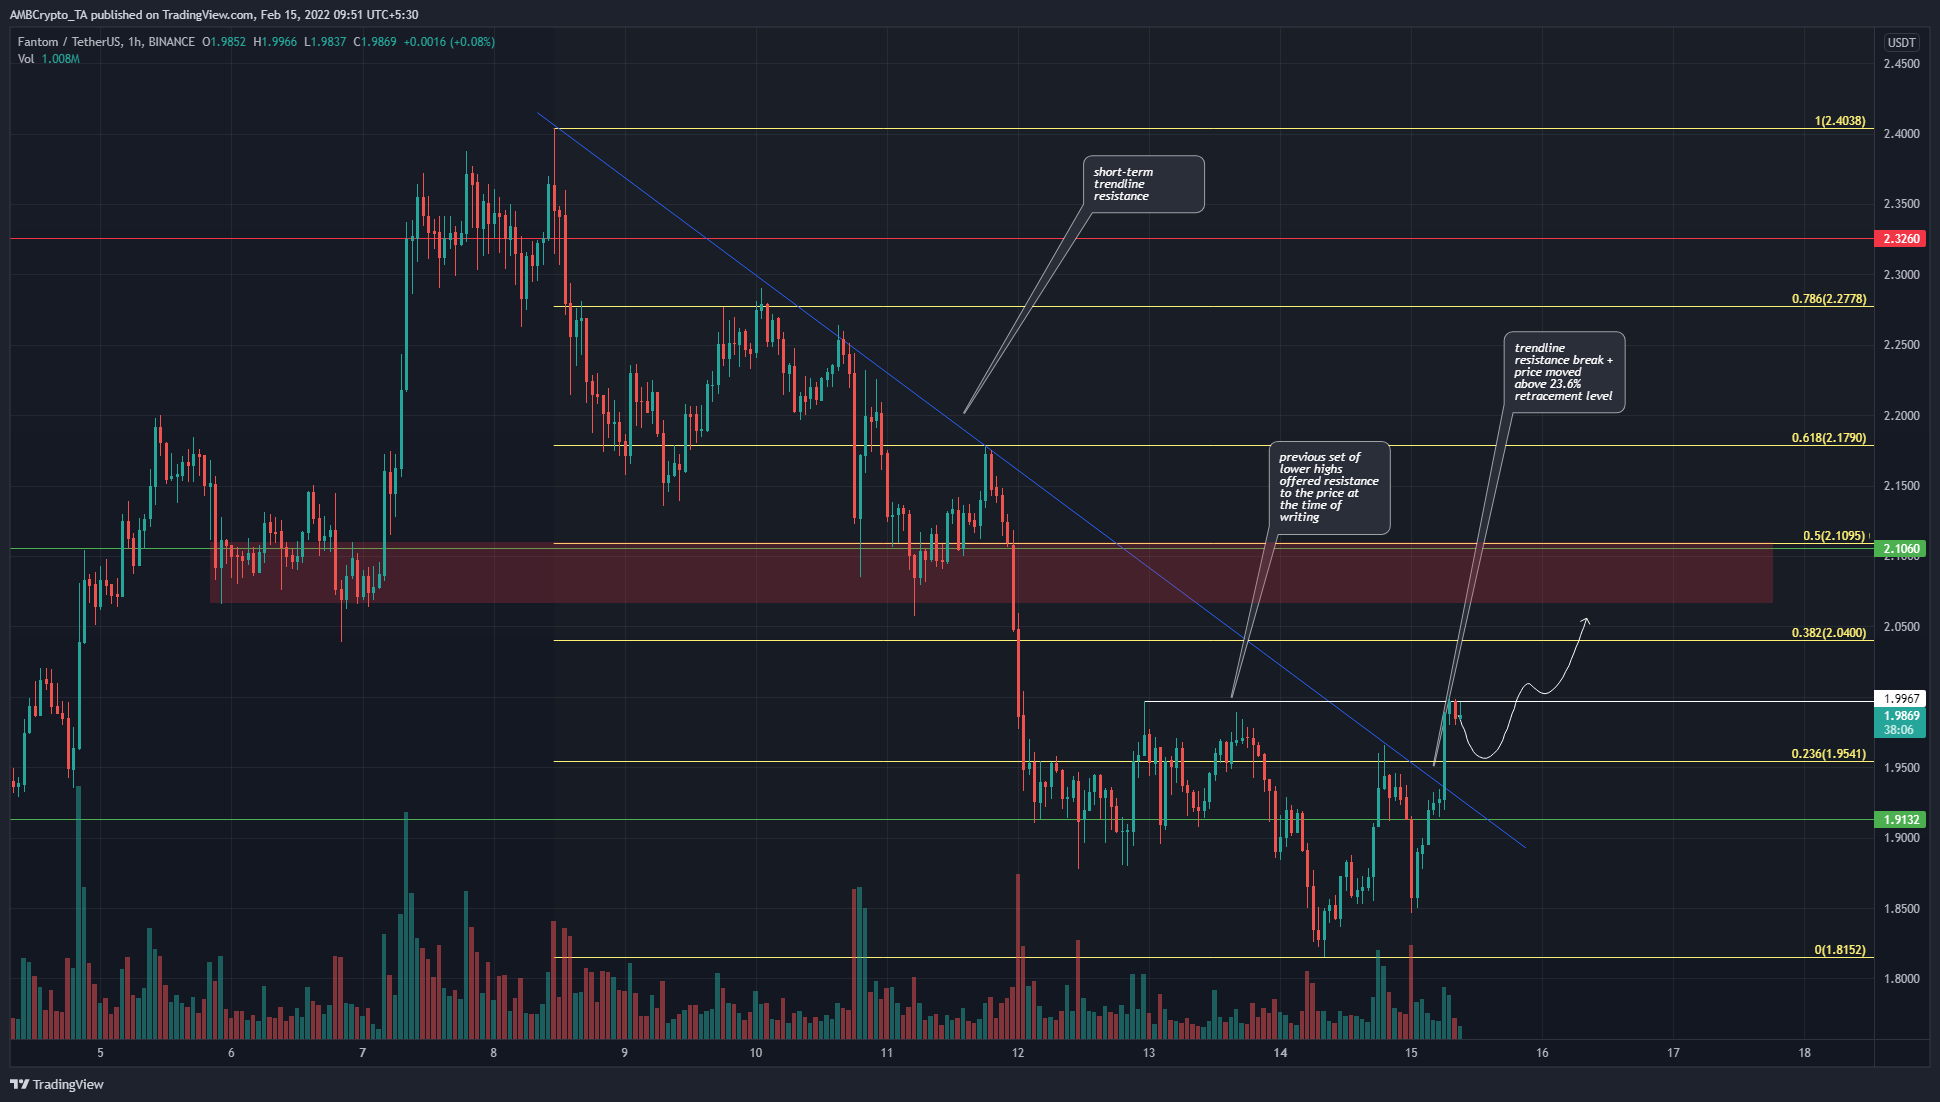
At the time of writing, the price broke above its week-long trendline resistance (blue) line. Moreover, the price was also above the 23.6% Fibonacci retracement level. These retracement levels were plotted based on FTM’s downward move from $2.4 to $1.81.
Generally, when the price manages to climb above the 23.6% retracement of such a move to the downside and flips the level to support, further gains are likely to follow. Therefore, if FTM can retest the $1.95-level as support and bounce back to $2, it is likely to head towards the $2.1-area (red box).
Consider the market structure of the past week as well – A steady downtrend and the most recent lower high was made a couple of days ago at the $1.99-mark. This was the level the bulls had to close a session above to indicate a shift in momentum back in favor of the buyers.
Rationale
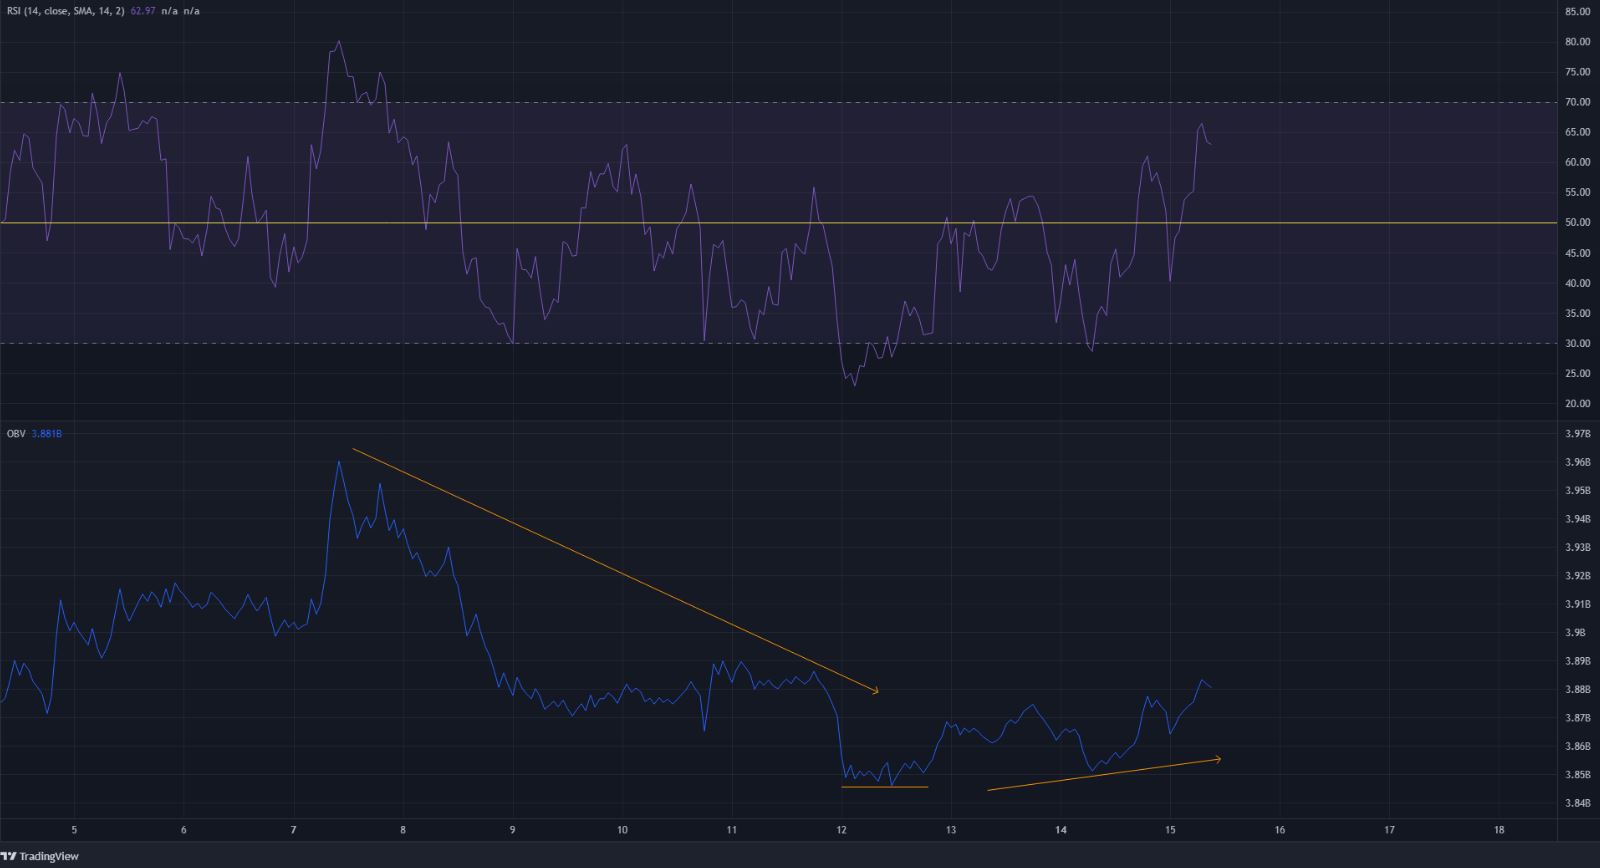
The RSI on the hourly chart climbed above neutral 50, and just as importantly, the RSI climbed above the 60-level at the time of writing too and stood at 62.97. Over the past couple of weeks, the 62-level saw some bullish momentum wane on the 1-hour chart for FTM, but this time could be different.
The OBV pictured a steady decline over the past week, but the past few days have seen buying volume to be equal to the selling volume, creating equal lows on the OBV. This was followed by a move upward – A sign of demand.
Conclusion
The bounce from $1.81 was fueled by some demand, and a break above the $1.99-level could shift the bias back towards the bullish side.
A retest of $1.95 as support could be a buying opportunity, with a target of the $2.1-resistance area to take profit at.