The odds on Shiba Inu [SHIB] bouncing to form new highs are…

Disclaimer: The findings of the following analysis are the sole opinions of the writer and should not be considered investment advice.
Bitcoin [BTC] attempted to climb past the $20.2k-$20.7k resistance zone in the past few days of trading. Shiba Inu [SHIB] also posted some gains over the past week, but its long-term trend remained bearish, stretching back to late October. Shiba Inu did not possess much momentum in recent days, but it has a strong support zone to the south. Can the bulls defend this area?
SHIB- 12-Hour Chart
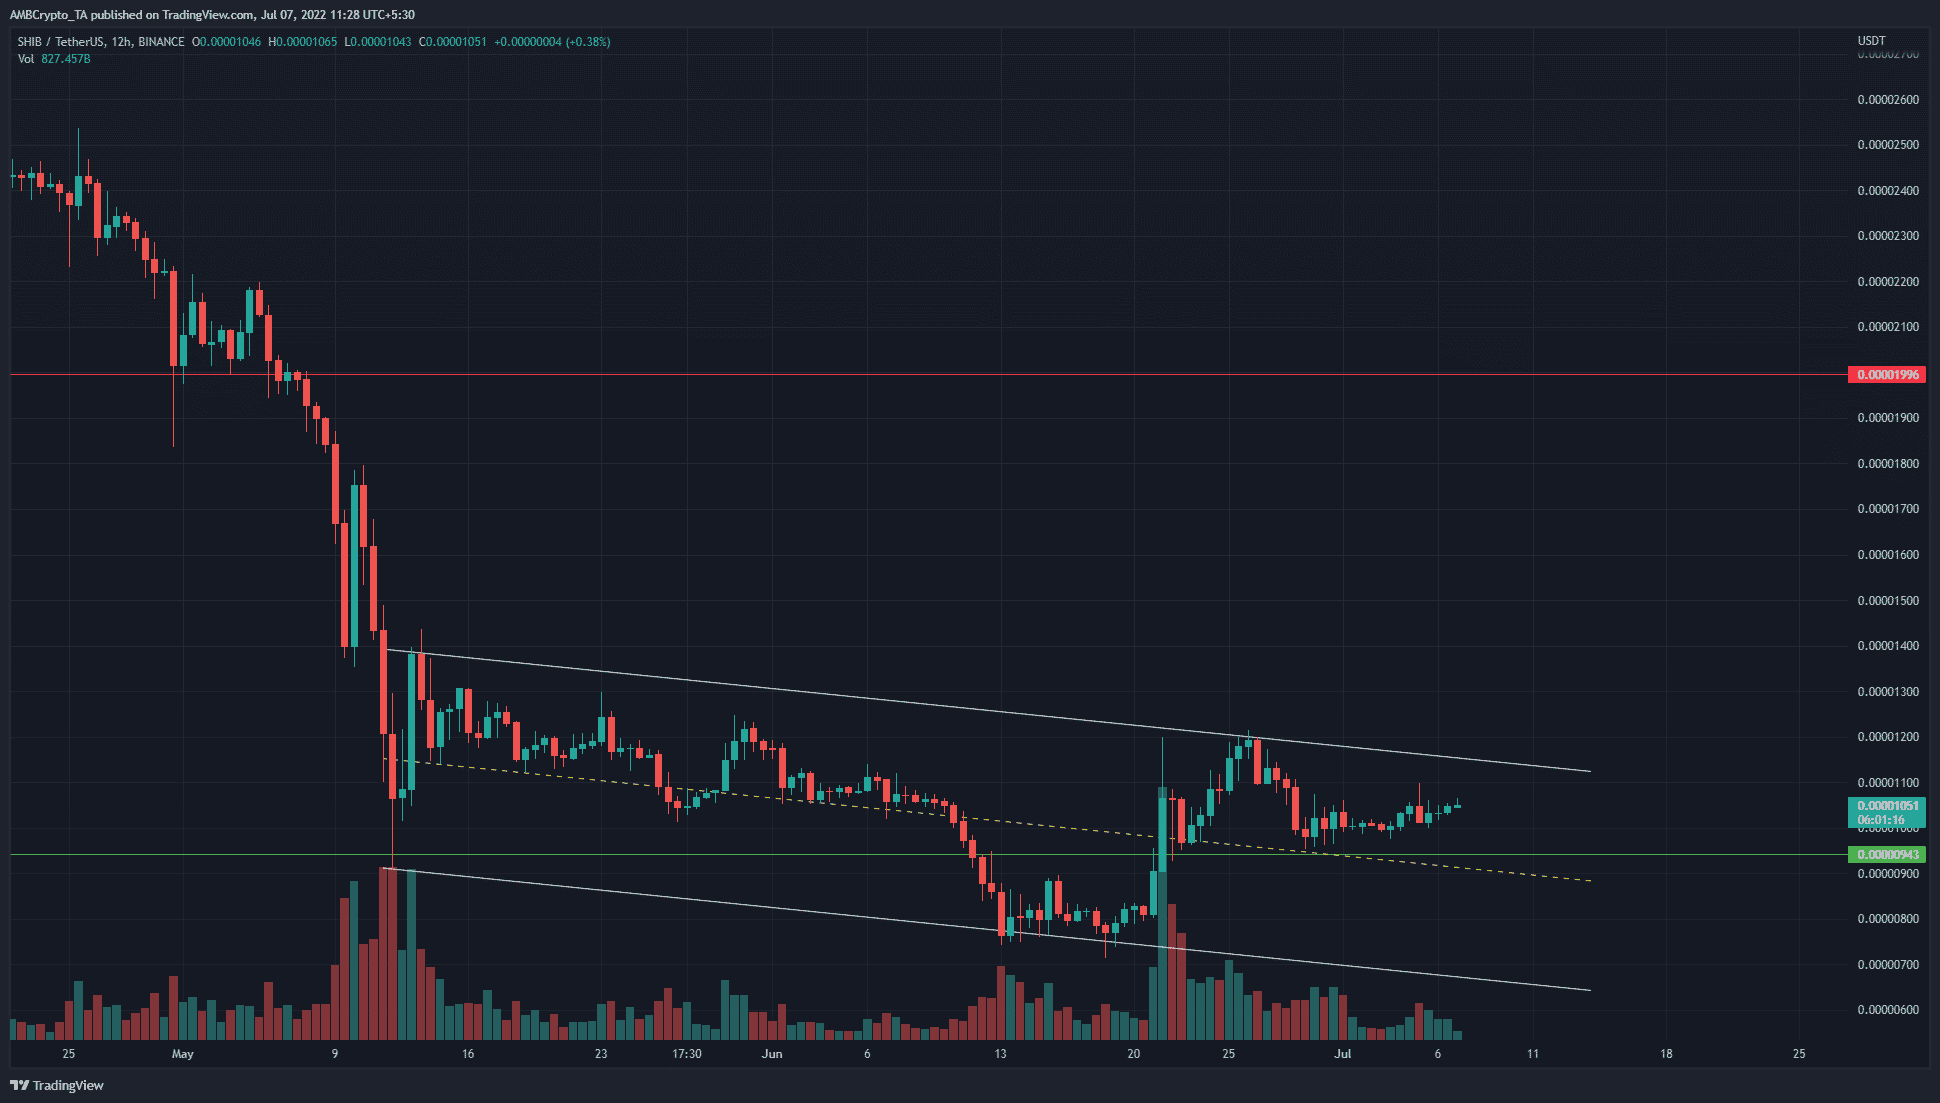
A descending channel (white) was plotted based on the price action of SHIB since May. The price has made a series of lower highs. However, the most recent lower high at $0.000011 was broken in late June, when SHIB closed a trading session at $0.000012, which was nearly 8% higher.
On one hand, we had a bullish market structure break. On the other was an unbroken descending channel. Which would prevail? In the next week or two, the $0.0000094 level would be important for the bulls to defend. It was a confluence of a long-term support level, as well as the channel’s mid-point. Hence, it would likely offer a bounce on a retest.
From where SHIB was trading at press time to $0.000011 represented an area of resistance from mid-May. If it were flipped to support, SHIB bulls can attempt to buy the coin with some confidence.
Rationale
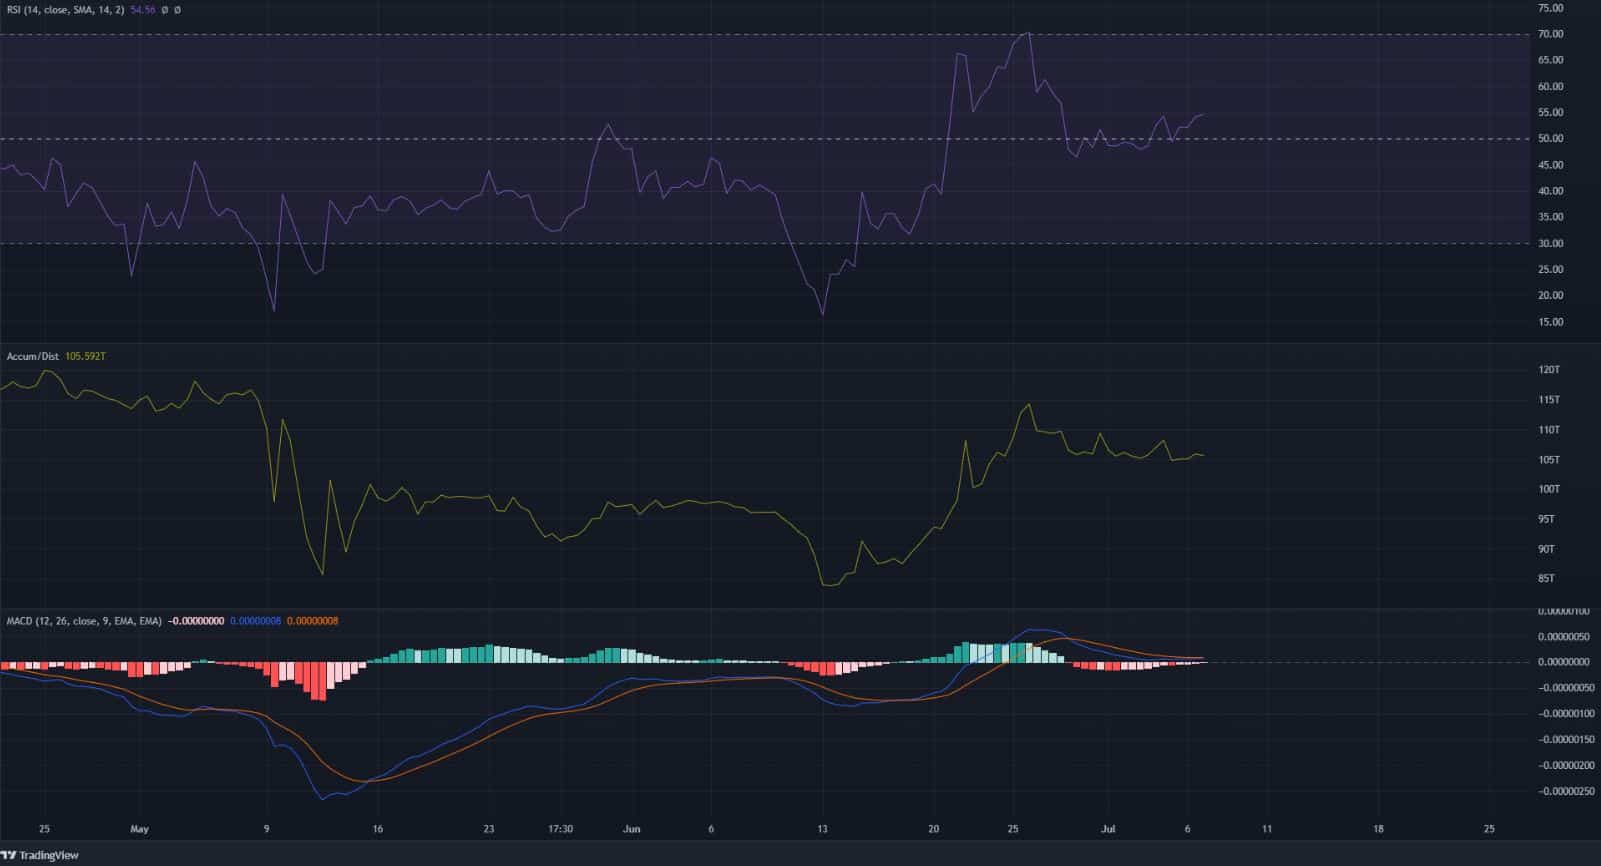
The Relative Strength Index (RSI) broke past the neutral 50 mark a couple of weeks ago and stood at 54 at the time of writing. This hinted at a bullish bias but neutral momentum in recent days. Similarly, the Moving Average MACD also crossed above the zero line in June but has dropped to the zero line over the past week.
The A/D indicator saw a spike upward in June, but the bulls were unable to press the issue in the past two weeks.
Conclusion
While strong buying volume led to the bullish market structure break, the bulls have been relatively quiet since then. Momentum was also flat. Hence, Bitcoin could end up dictating the direction of SHIB in the next week or two. The support zone confluence at $0.0000095 would offer a relatively low-risk buying opportunity upon a retest.


