The Sandbox price charts show where another wave of selling could occur

Disclaimer: The information presented does not constitute financial, investment, trading, or other types of advice and is solely the writer’s opinion.
- The market structure remained bearish.
- A revisit to the breaker on the charts was a possibility.
The Sandbox experienced a security issue toward the end of February. This occurred when an employee’s computer was accessed by an unauthorized third party. Emails containing malware were sent out that were falsely claimed to be from The Sandbox.
Read The Sandbox’s [SAND] Price Prediction 2023-24
The Sandbox has been bearish on the charts since 22 February. This security incident might not have swayed near-term sentiment to bearish, for the sentiment was already in favor of the sellers.
A bounce in SAND prices shouldn’t be a surprise, but the trend remained bearish
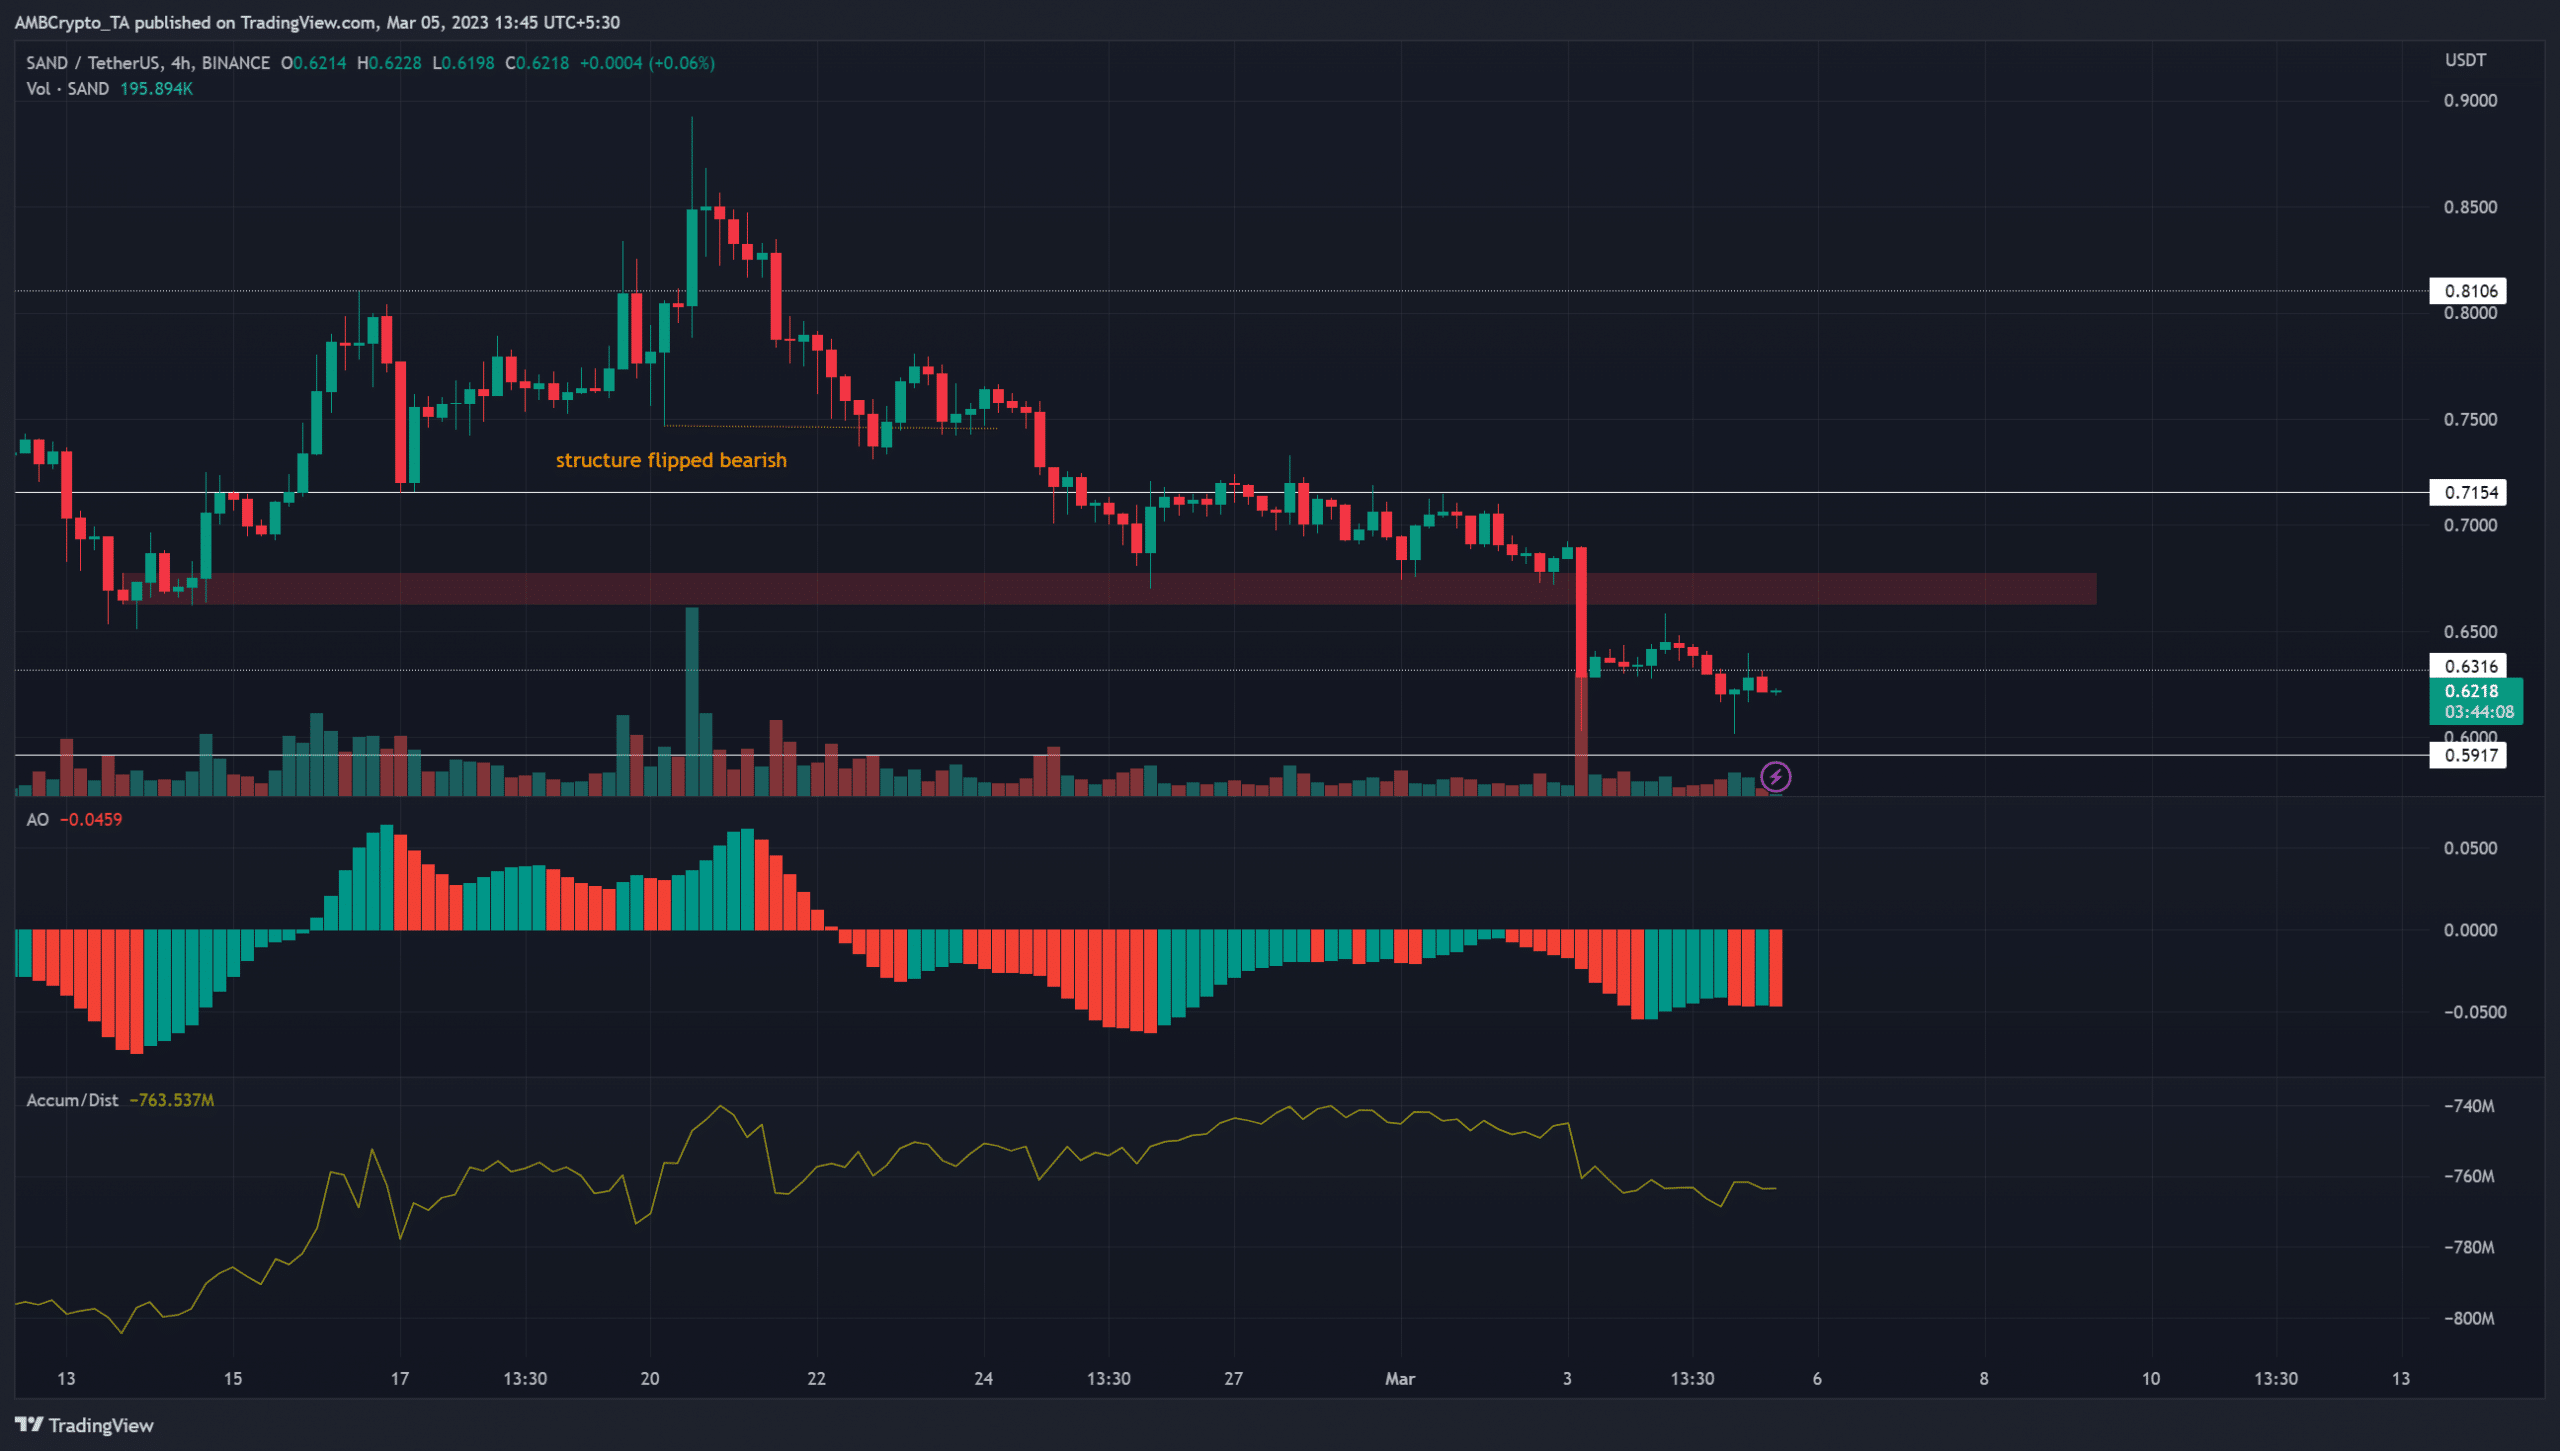
The H4 bearish market structure break was highlighted in orange and shifted the bias toward the bears. At the same time, the Awesome Oscillator also fell beneath the zero line and showed a strong downtrend in progress.
At the time of writing, the AO did not yet step back above the zero line. However, the A/D line made a series of higher lows till the end of February but slid lower in the past few days.
Overall, the indicators showed strong selling pressure in March but also hinted at some accumulation in the last week of February.
Realistic or not, here’s SAND’s market cap in BTC’s terms
The red box at $0.66 denoted the bearish breaker that SAND formed on 13 February. At that time, the swing low at $0.65 was followed by a rally to $0.81 and $0.89.
On the way down, this former bullish order block failed to halt the bears’ advance, hence it was a bearish breaker. It also has confluence with the fair value gap SAND left on the charts.
Therefore, a revisit to the $0.65-$0.68 area would present an ideal selling opportunity for SAND traders. To the south, the $0.59 and $0.53 levels were notable support levels.
The falling MVRV ratio showed the holders were enduring losses
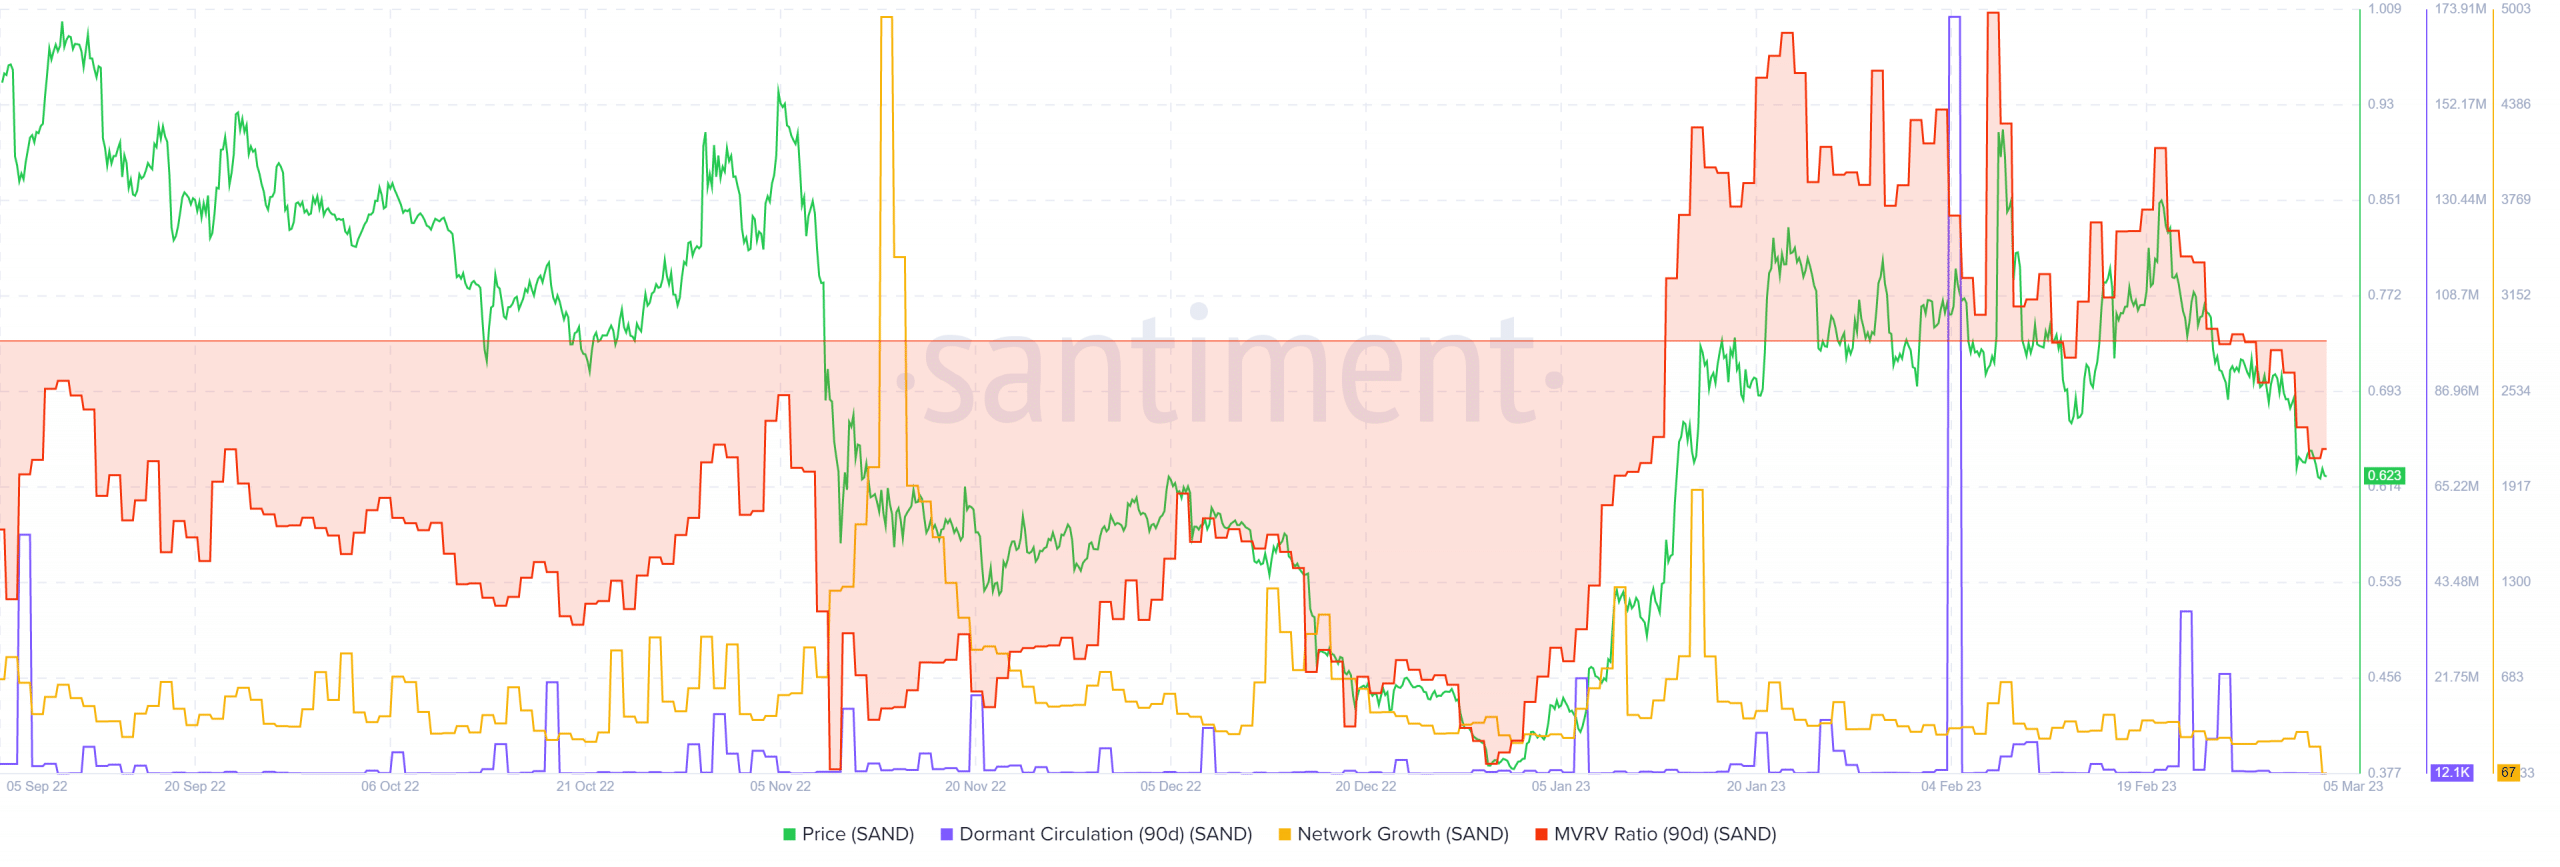
The dormant circulation saw a huge spike on 4 February. At that time, The Sandbox was trading at $0.8 and fell by 11% just three days later to fall to $0.7. In the past few weeks, the 90-day dormant circulation did not note a spike, which suggested strong selling pressure might not be present.
However, the 90-day MVRV ratio slid into negative territory and indicated that SAND holders’ portfolio was in the red. Moreover, the network growth metric did not note gains in recent weeks either.
Taken together, the metrics showed a lack of growth and the falling prices fueled bearish sentiment. A spike in the dormant metric circulation could warn traders of another sharp move downward.