The Sandbox [SAND]: Will bearish history repeat itself with new unlock?
![The Sandbox [SAND]: Will bearish history repeat itself with new unlock?](https://ambcrypto.com/wp-content/uploads/2023/02/SAND.jpg)
- SAND tokens worth $260 million would be unlocked soon.
- On-chain metrics and market indicators looked bearish.
Token Unlock revealed a major update related to The Sandbox [SAND], which could have a major impact on the network. As per a 13 February tweet, 372.57 SAND worth $260 million would be unlocked. The newly unlocked tokens would account for 12.4% of the total supply.
✨This week's notable unlock✨
🚨 More than $420 Million unlocks !! 🚨
🔎 the major unlock to monitor is $SAND 🔎$SAND 12.4% – $260M (🌟)$BIT 1.9% – $107M $APE 0.7% – $38M $DyDx 0.6% – $16M $EUL 0.3% – $0.7M$GAL 0.1% – $0.4M
Source: https://t.co/8XoTR8tBPT pic.twitter.com/ogbieAuu0F
— Tokenomist (@Tokenomist_ai) February 13, 2023
Read The Sandbox’s [SAND] Price Prediction 2023-24
After unlocking, the tokens would be allocated to others in different proportions. 12% of the unlocked tokens will be allocated to the Binance [BNB] Launchpad sale, 17% to the seed sale, 12% to the foundation, and 19% to the team, while over 25% for reserve.
2.$SAND Allocation & Supply Schedule
– Binance Launchpad Sale: 360M $SAND(12%)
– Seed Sale: 515.3M $SAND(17.2%)
– Strategic Sale: 120M $SAND(4%)
– Foundation: 360M $SAND(12%)
– Team: 570M $SAND(19%)
– Advisors: 300M $SAND(10%)
– Reserve: 774.7M $SAND(25.8%) pic.twitter.com/RKlZBxNI0r— Lookonchain (@lookonchain) February 13, 2023
This update might concern investors, as, if historical trends were to be considered, things might get tougher. Last year, there were two SAND unlocks, both of which were followed by price declines.
According to CoinMarketCap, SAND’s price has already declined by over 10% in the last 24 hours, and the unlock could push its price even lower. At the time of writing, SAND was trading at $0.6664 with a market capitalization of over $998 million.
Are there chances of a downtrend?
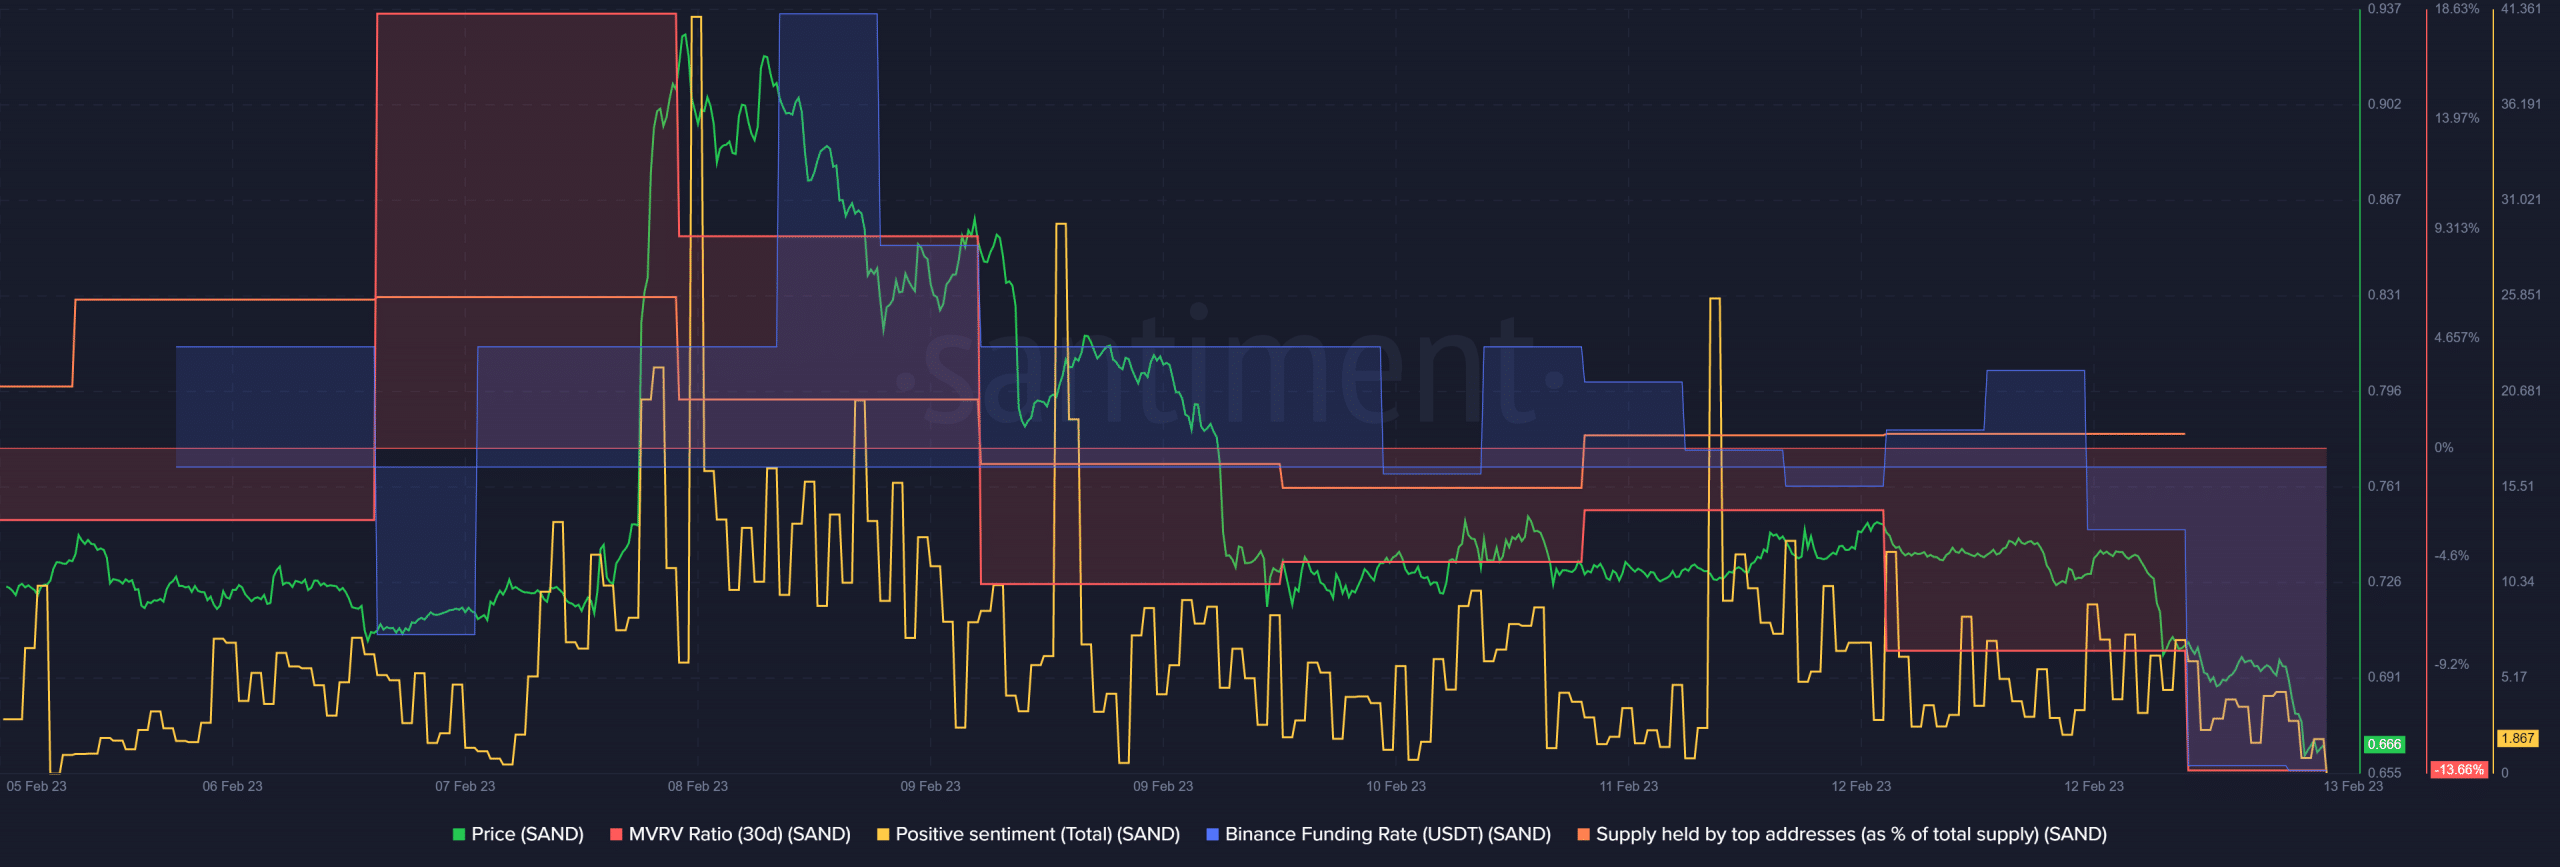
A look at SAND’s on-chain metrics gave more reasons to worry, as they suggested a further decline in the token’s price over the coming days. SAND’s MVRV Ratio was down considerably, which was bearish. Demand from the derivatives market also fell as SAND’s Binance funding rate declined.
SAND’s supply held by top addresses decreased slightly, which also looked negative. Furthermore, positive sentiments around SAND went down, reflecting less confidence among investors in the token.
CryptoQuant’s data revealed that SAND’s net deposits on exchanges were high compared to the 7-day average. This too was a bearish development, as it indicated higher selling pressure.
Realistic or not, here’s SAND market cap in BTC’s terms
What can SAND investors expect?
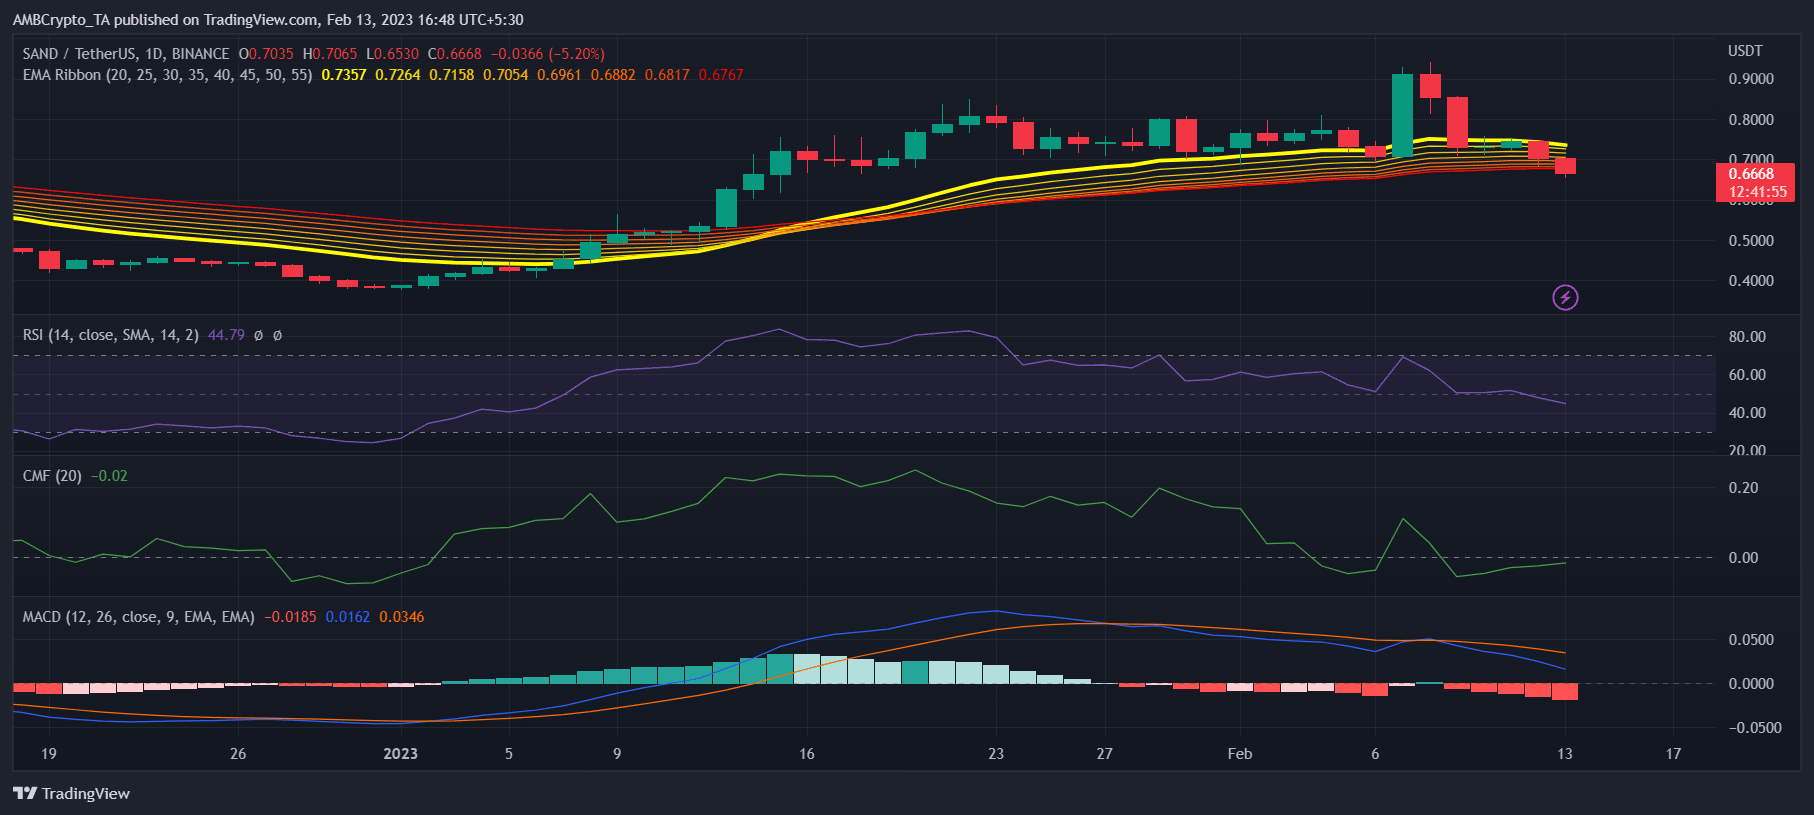
SAND’s daily chart further increased the possibility of a downtrend as the market indicators were bearish. The MACD revealed that the bears had the upper hand in the market. SAND’s Relative Strength Index (RSI) registered a downtick and was headed further below the neutral mark, which was a development in the sellers’ favor.
The distance between the 20-day Exponential Moving Average (EMA) and the 55-day EMA was reducing, increasing the chances of a bearish crossover soon. Nonetheless, the Chaikin Money Flow (CMF) went up slightly, which was a bullish move.