The state of Arbitrum, Optimism as new trends emerge
In the past 24 hours, Arbitrum and optimism have declined in TVL. Has it affected their dominance of the L2 space?

- Arbitrum and Optimism witnessed a decline in TVL.
- ARB and OP resume downward trends after a little respite.
Arbitrum [ARB] and Optimism [OP] continue to lead the L2 space with the highest Total Value Locked. However, there has been a recent decrease in their TVLs. Given this development, what is the current trend in network volume?
Arbitrum and Optimism see a reduction in TVL
An analysis of the L2 Beats chart over the past 24 hours showed that Arbitrum and Optimism have seen reductions in their Total Value Locked (TVL).
Arbitrum’s TVL has experienced a nearly 9% decline, while Optimism’s decreased by over 12% at the time of this report.
Despite these significant drops, their standings relative to other L2 platforms remain unaffected. Presently, Arbitrum maintains a TVL dominance of over 49%, with a total of over $10 billion.
Optimism holds almost 25% dominance with a TVL of over $5 billion.
Volume excitement dies down
The Arbitrum volume chart on DefiLlama showed a noteworthy surge in volume earlier in the year. The chart showed that the volume went over the $1 billion threshold multiple times during the month.
The initial entry into this zone recorded a volume of around 1.8 billion, marking the highest point in its history. However, the volume has since declined, and as of the present analysis, it was around $542 million.
Similarly, an analysis of the Optimism volume displays a parallel pattern.
At the beginning of the year, there was a substantial increase in volume, reaching as high as $184 million. However, the volume reduced over time and is currently around $48 million. This decline in volume serves as an indicator of reduced transaction activity on both networks.
ARB and OP witness declines
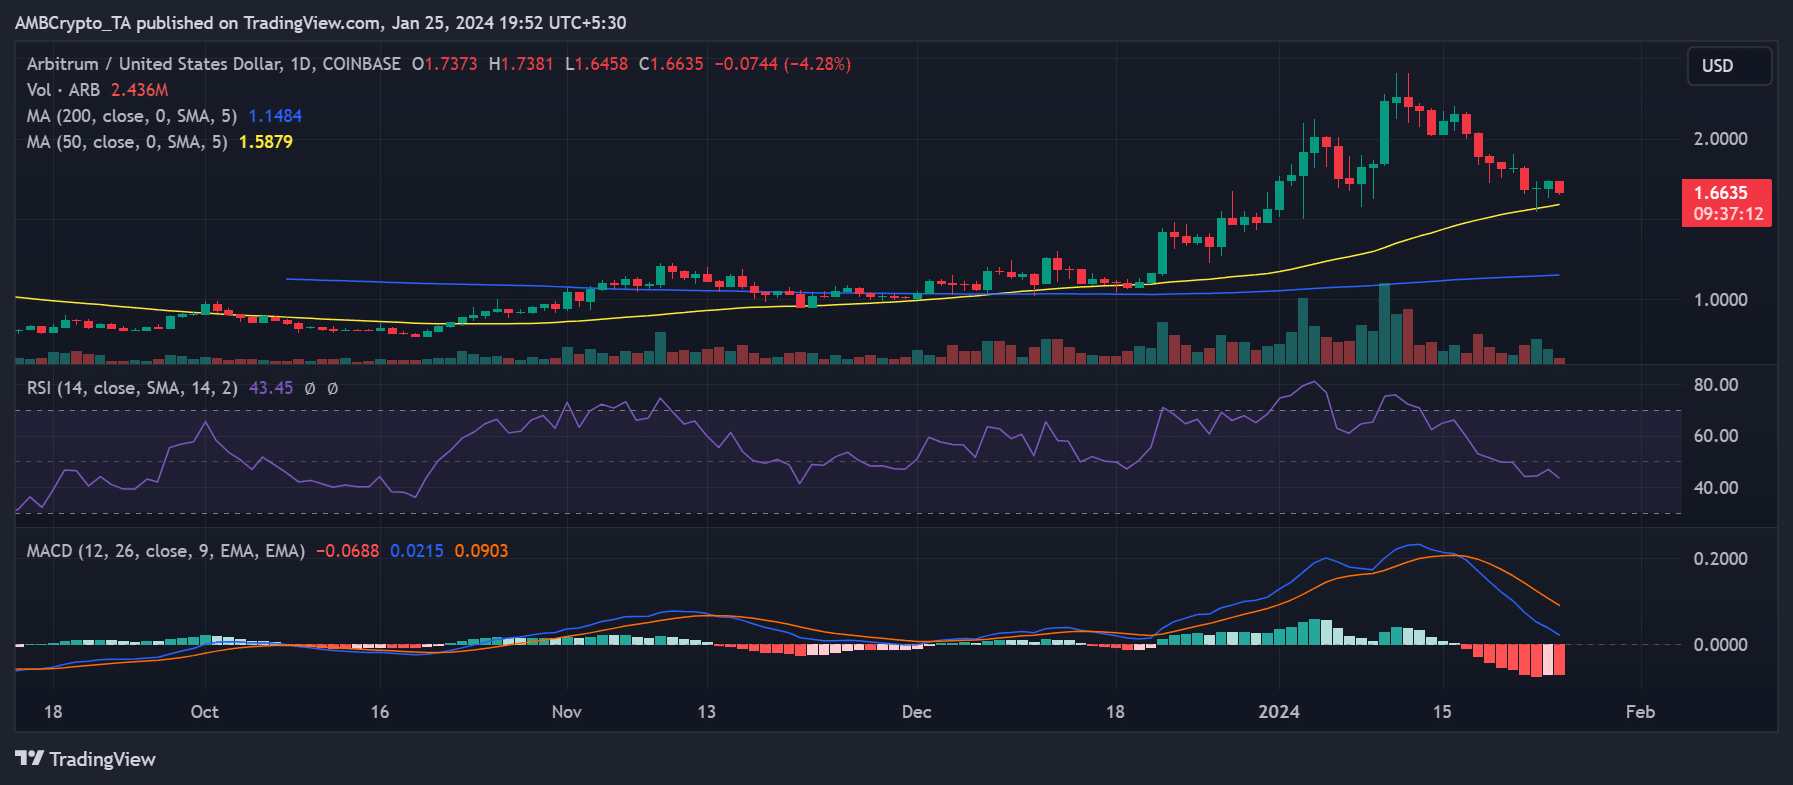
On the Arbitrum daily timeframe chart, a brief respite from its decline was observed on 24th January, during which it added around 2.8% in value.
However, the current situation reflects a return to the downtrend, marked by a decline of over 4%. ARB is presently trading at around $1.6.
Despite the Relative Strength Index (RSI) and Moving Average Convergence Divergence (MACD) signaling bearish indications, the price remained above its short moving average (yellow line).
Realistic or not, here’s ARB’s market cap in BTC terms
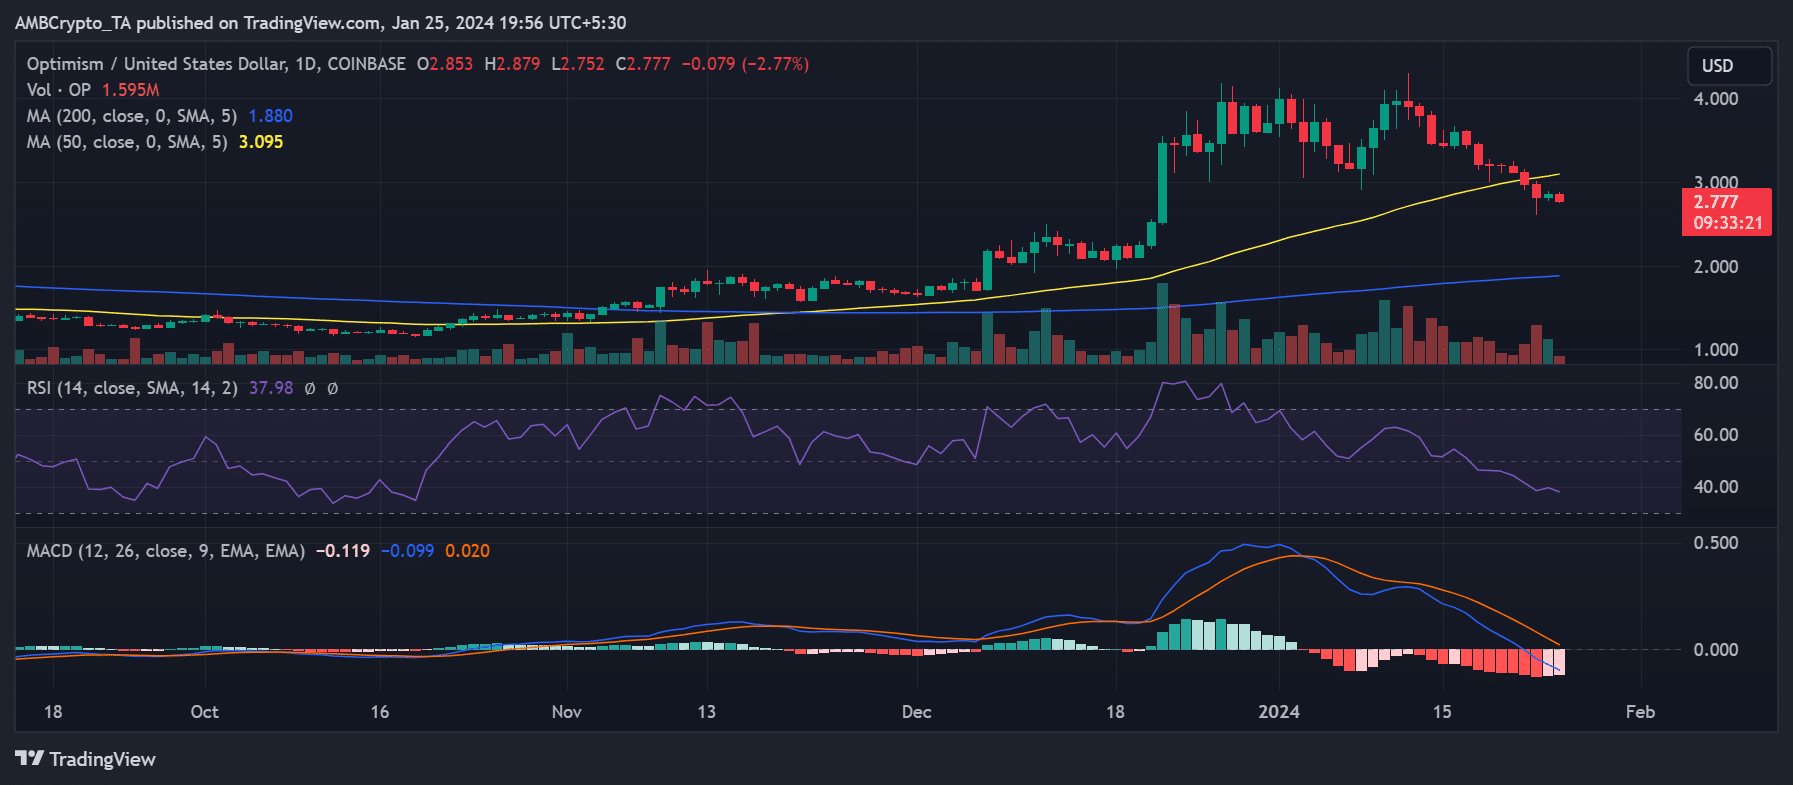
In contrast, all metrics for Optimism showed a bearish trend.
At the time of this report, it was trading at around $2.7, registering a 2.7% decline. Additionally, it is trending below its yellow line and the neutral line of its RSI, signaling a bearish sentiment.