
- Positive sentiment around FLOKI remained high.
- Market indicators turned bearish on the meme coin.
Floki Inu’s [FLOKI] 15-minute price chart flagged a bullish signal, as the meme coin’s value went above a resistance level. The uptrend hinted that its value might reach $0.00025447 once again.
Therefore, AMBCrypto checked FLOKI’s metrics to find out what to expect.
FLOKI breaks above a resistance zone

Source: TradingView
AMBCrypto’s analysis via Santiment revealed that FLOKI’s Whale Transaction Count had increased sharply over the last few days. Though this might look bullish at first glance, the scenario was actually the opposite.
Notably, the meme coin’s Exchange Inflow spiked during that time. This clearly meant that the big players in the crypto space were dumping FLOKI.
A rise in selling pressure usually puts an end to an asset’s bull rally. Additionally, its MVRV ratio plummeted sharply in the last few days, which was also a bearish signal.
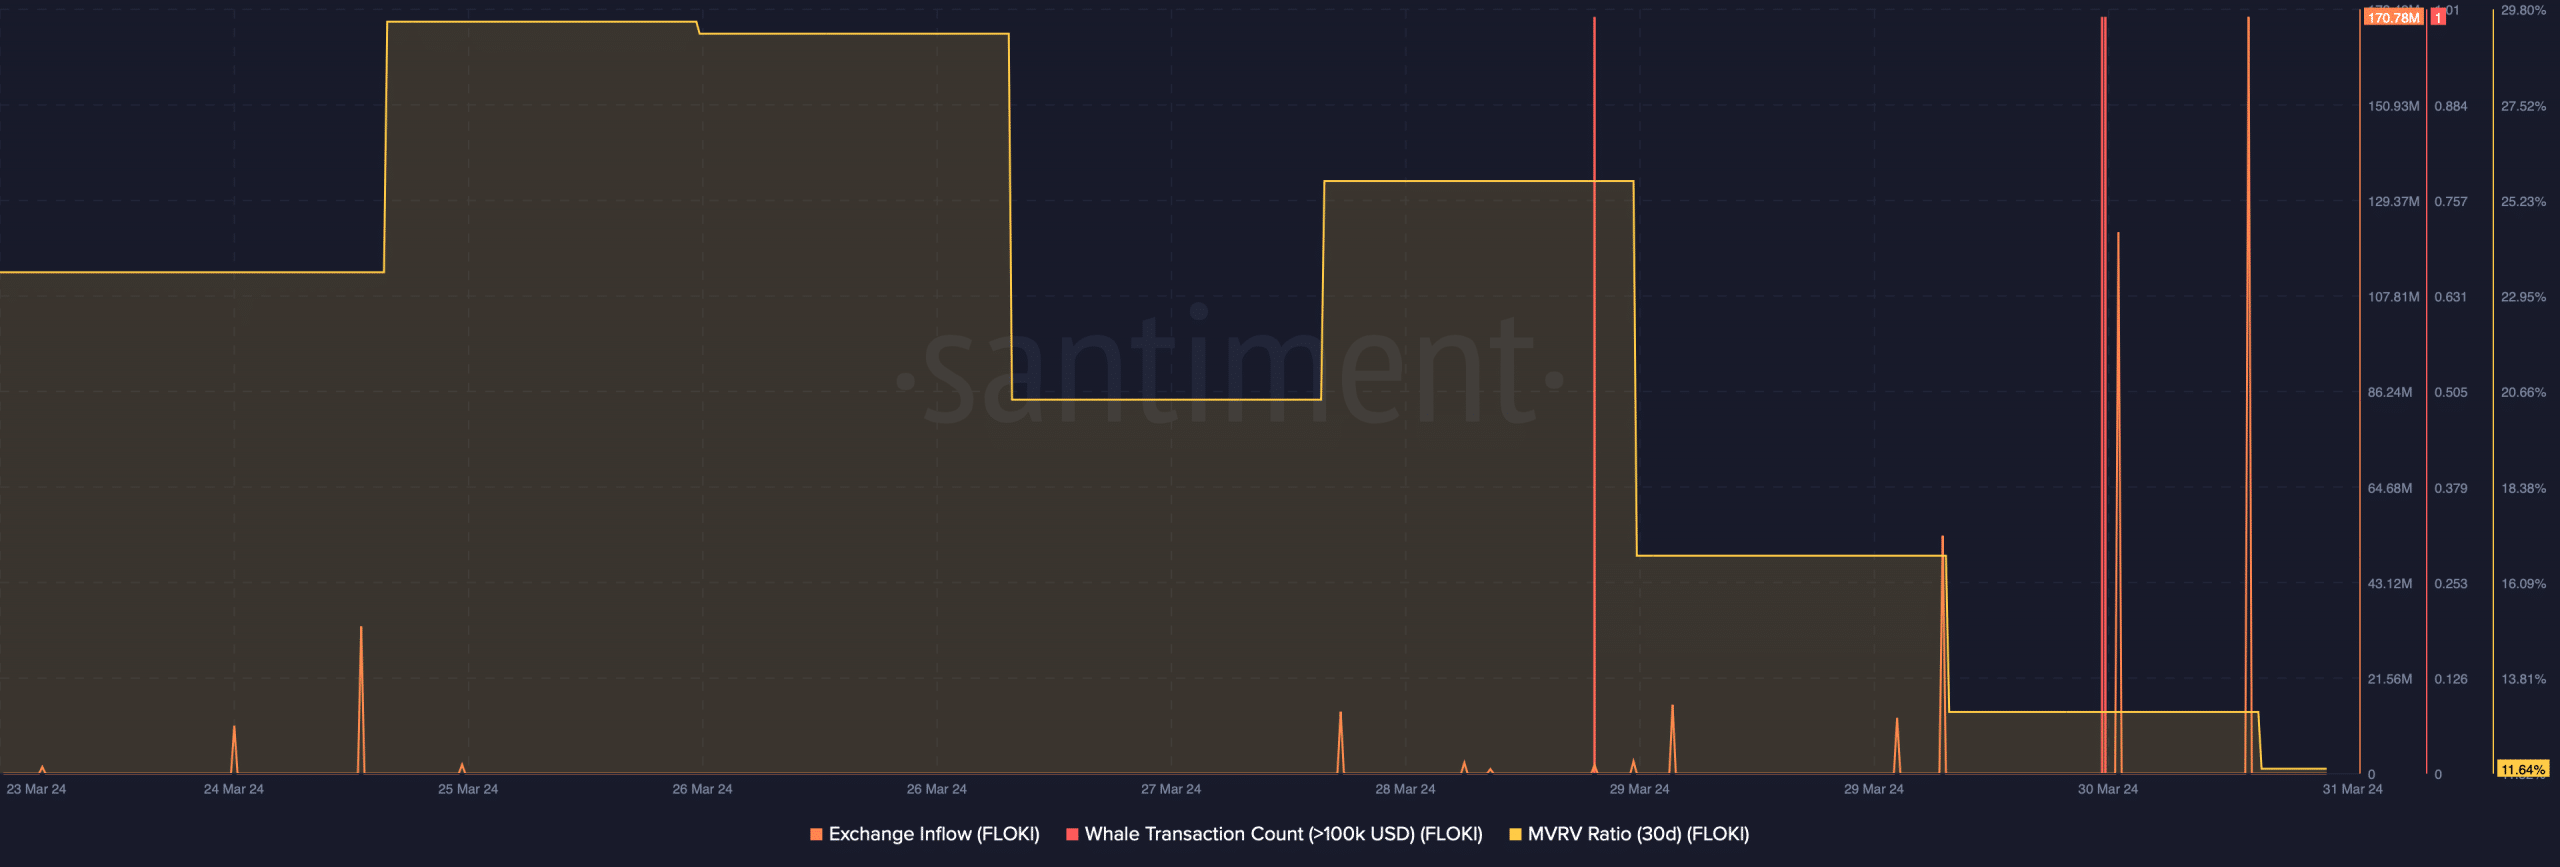
Source: Santiment
Despite the bearish metrics, positive sentiment around FLOKI spiked quite a few times last week, reflecting investors’ confidence. This could have played an additional part in FLOKI’s recent bullish action.
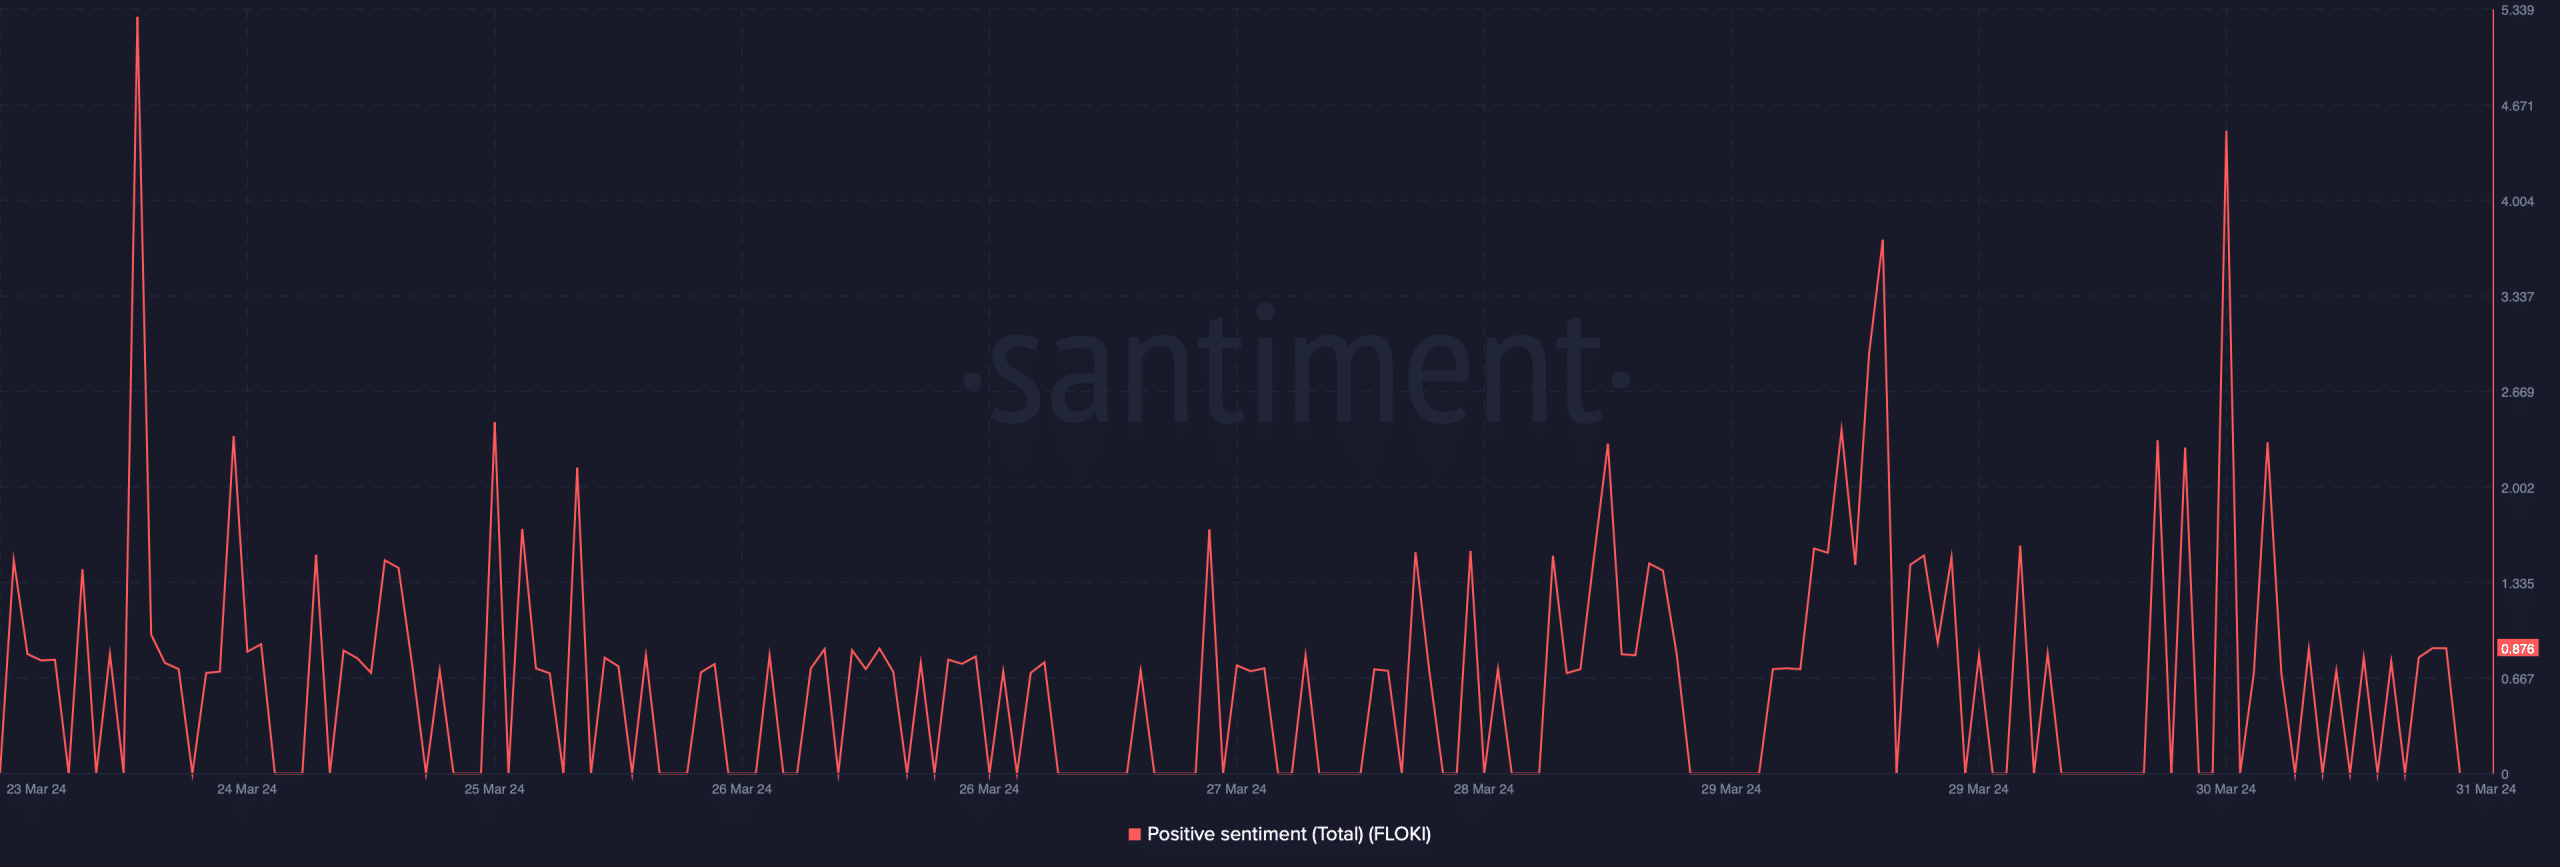
Source: Santiment
According to CoinMarketCap, in the last few hours alone, the meme coin’s value surged by over 4%, allowing it to go above the aforementioned resistance level.
At press time, the meme coin was trading at $0.0002494 with a market capitalization of over $2.38 billion, making it the 55th largest crypto.
To understand whether investors’ confidence in FLOKI will translate into a continued bull rally, AMBCrypto then took a look at its daily chart.
Our analysis revealed that most of FLOKI’s indicators were downward-looking at press time. Notably, the MACD displayed a bearish crossover.
Realistic or not, here’s FLOKI’s market cap in BTC’s terms
The Relative Strength Index (RSI) also went sideways, indicating that investors might expect a few slow-moving days. Similarly, the Bollinger Bands revealed that FLOKI’s price was in a less volatile zone.
Thus, the chances of an unprecedented northward bull rally in the near term seemed slim.

Source: TradingView