These 3 metrics indicate this about AAVE’s price movement

The past week was pretty bad for both Bitcoin and altcoin bulls. The crypto market hardly witnessed any major upswing as most coins continued consolidating. Such was the case with AAVE too. The 27th largest crypto was found recovering from its 16% weekly drop and was trading exactly at $250 at press time.
At this stage, the unanswered question remains – Would AAVE’s bearish phase conclude any time soon? Well, three of the token’s on-chain metrics presented a different picture.
1. Take the age consumed metric, to begin with.
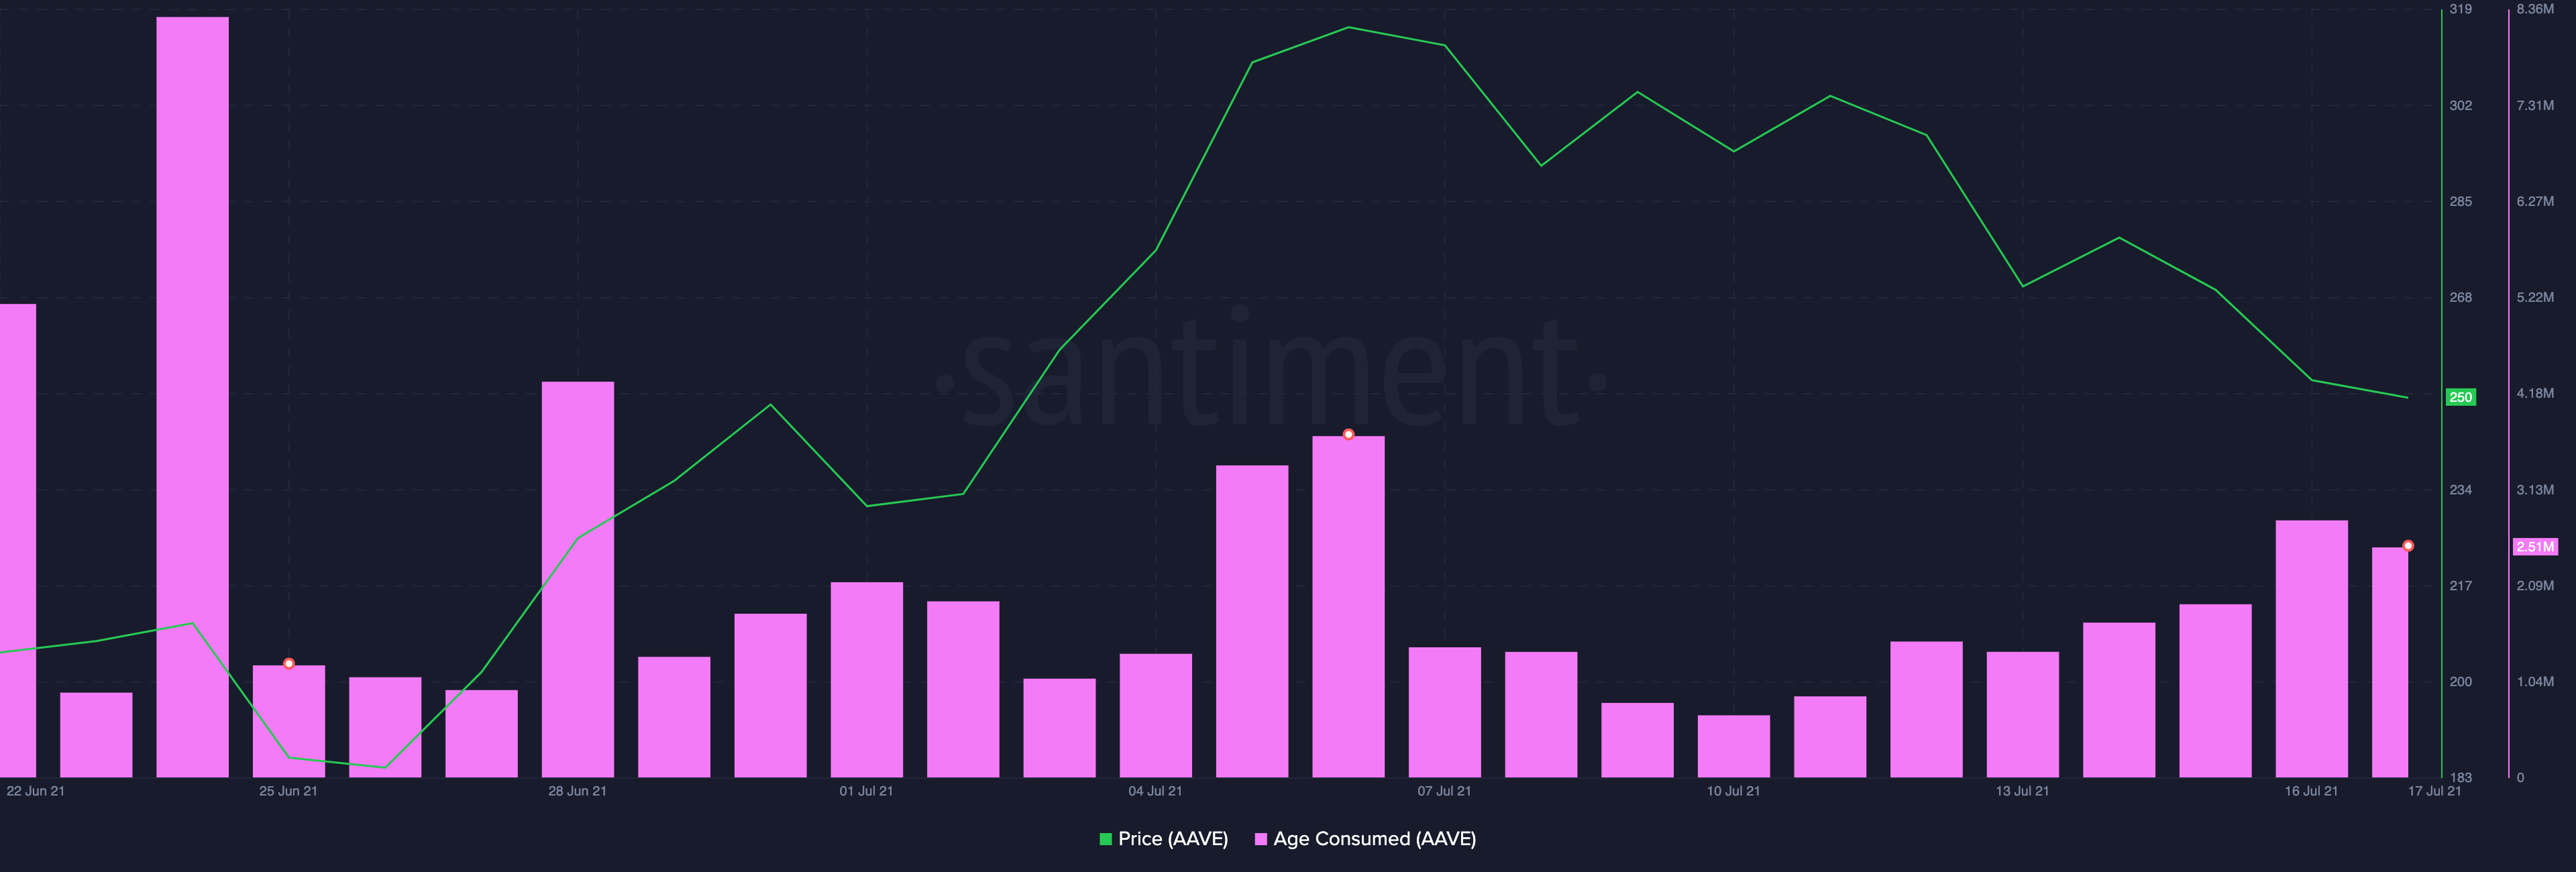
This indicator pointed out that a significant number of previously idle AAVE tokens have been moving between addresses since the 10th of July. The spikes observed in the chart essentially indicate that early investors have been selling their tokens and that, in hindsight, has contributed to AAVE’s recent price decline. If the same trend prolongs, AAVE’s price would continue to plunge.
2. NVT ratio
The NVT ratio indicated another trend. As a matter of fact, whenever this ratio is low, it implies that the network value is not keeping up with the increased usage of the network. Having said that, such a move usually represents a bearish signal. Now even though the curve seemed to be moving northwards at press time, a change in trend could not be confirmed because of two main reasons.
One, the current ratio (33.7) is evidently nowhere close to its 6 June peak (95.1). Two, looking at the recent curve behavior, it’d be fair to assume that the emerging uptick would soon translate itself into a downtick in the next few days. Nonetheless, if the current uptrend continues, a parallel rise in price could be anticipated.
Having noted the aforementioned scenarios, the odds of the bear phase prolonging seems to be more plausible than a change in trend, at the moment.

3. Exchange inflow
Additionally, the exchange inflow volume also indicated that people were parting ways with their holdings – which, again, is not a very good sign for AAVE’s price. As indicated in Glassnode’s chart, the total number of tokens transferred to exchanges has been on the rise over the last couple of days. On 10 July for instance, merely 10.5k tokens were transferred to exchange wallets, while the same at press time reflected a value of 48.6k.
Additionally, DeFiPulse’s chart pointed out that the Total Value Locked (TVL) in AAVE has not gained momentum as such. The ups and downs have been pretty inconsistent and AAVE has, arguably, been losing dominance in the DeFi space of late.
Keeping this factor and all the aforementioned metric signals in mind, it can be concluded that AAVE would likely not witness any relief rally in the next few days.


