These are the areas that will present heavy selling pressure for Chainlink

Disclaimer: The findings of the following analysis are the sole opinions of the writer and should not be considered investment advice
Chainlink bulls were hopeful in early February that $15.3 was defended and a longer-term rally might have been initiated. However, their hopes were dashed when the $18 resistance zone simply did not budge. The wider market sentiment has also not been particularly bullish. Quite the opposite, it has been fearful on the longer timeframes. Like many other altcoins, Chainlink was on a downtrend as well.
LINK- 1D
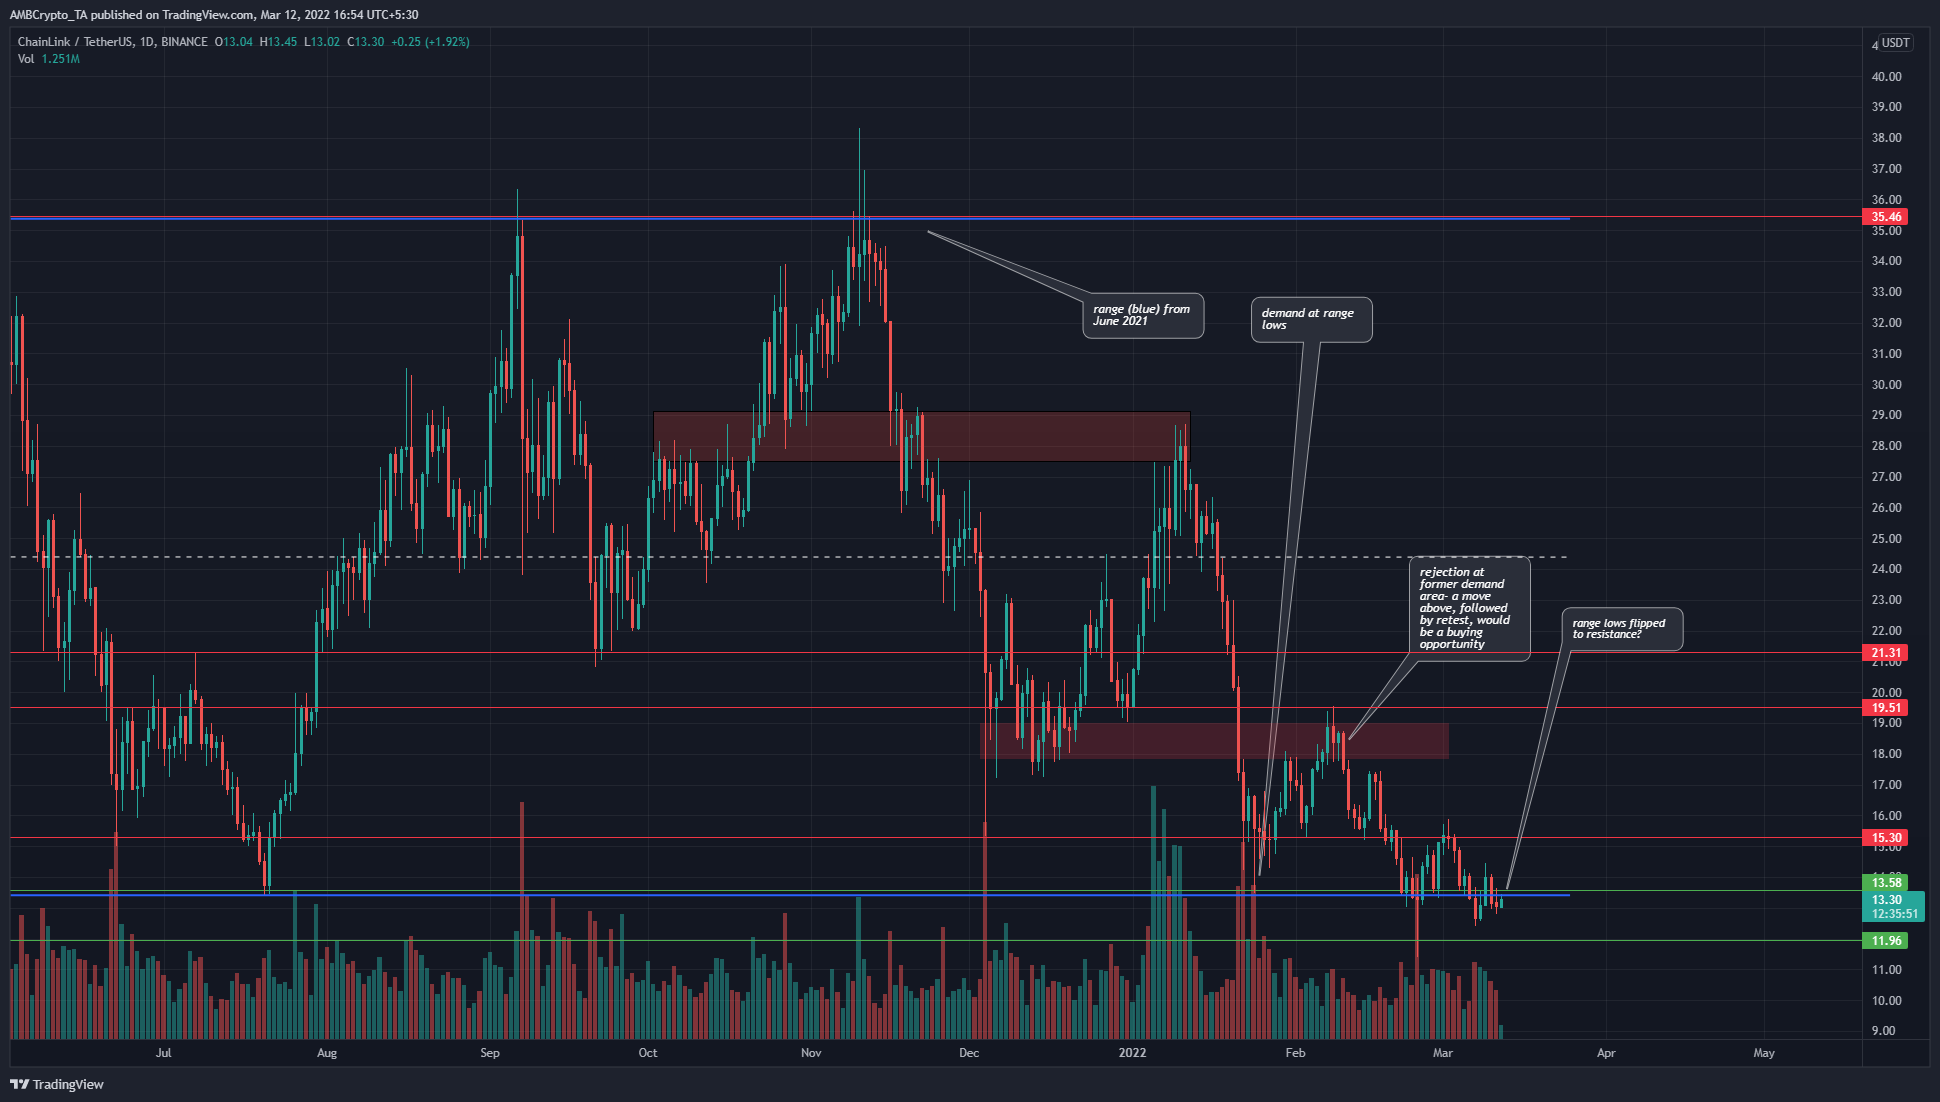
At the time of writing, LINK was trading just beneath the range lows (blue) at $13.5. In the past, this was an area where investors sold the clothes on their back to go “all-in” on LINK. In mid-July, a visit to this area was followed by a strong move back to the range highs.
However, since November, the $29 and $18 areas (red box) have served as resistance areas. In the event that demand can drive prices back above the $14 mark, these are the areas that will present heavy selling pressure for the asset.
On the other hand, a move below in the coming days would likely flip the $13.5 area into a supply zone.
Rationale
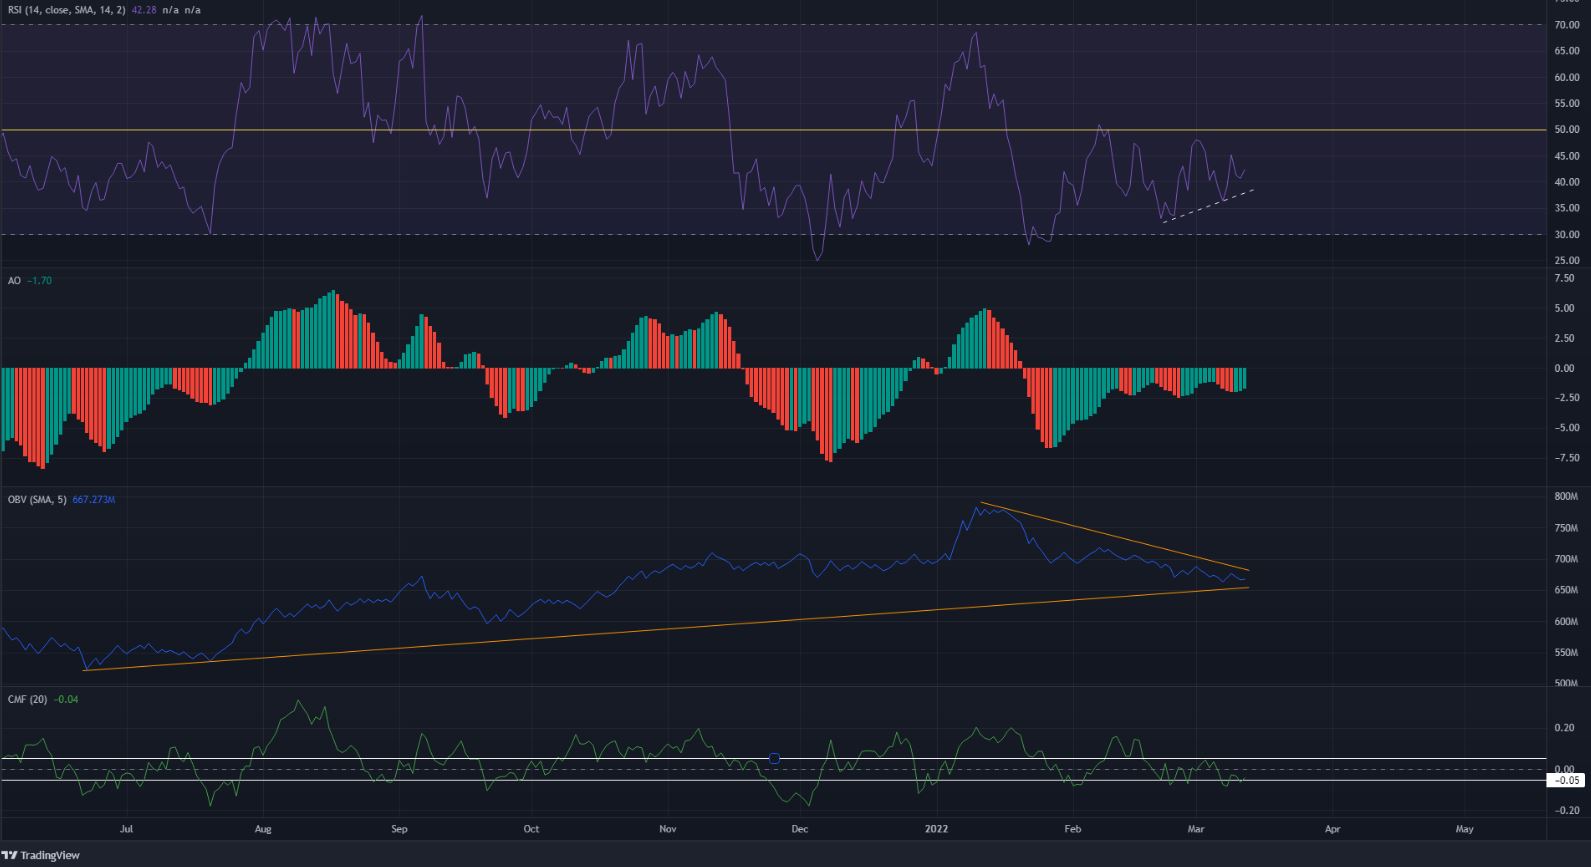
The RSI made a series of higher lows even as LINK made lower lows- a bullish divergence. This divergence could see the price push back above $13.5. However, the RSI was still beneath the zero line- momentum was not yet in favor of the bulls. It was a similar tale on the AO- momentum was bearish, but has been waning slightly in the past month.
The OBV has also formed higher lows in the past nine months- which meant buying volume was present even on longer timeframes. But the OBV has been dropping in the past two months- and where the OBV goes next could set the tone for the next few weeks. The CMF was at -0.04, in neutral territory but bordering on showing capital flow out of the market.
Conclusion
The inability of the bulls to defend the range lows was a marker laid down by the bears- they have come to town in force once more. The indicators showed bearish momentum could be waning, but this indication was weak and another wave of selling could comment. To the south, $11.96 and $9.8 could offer support. A daily session close above $13.6 could see another bounce, but the trend remains bearish.