THETA, Terra, FTX Token Price Analysis: 22 April

Bitcoin dropped from $42.8k to $39.7k in the hours preceding press time. This saw altcoins pullback as well. However, coins like THETA still had a bullish case to be made based on price action. LUNA and FTT had a bearish outlook, although LUNA is more likely to see some demand arrive in the next few hours.
Theta Network (THETA)
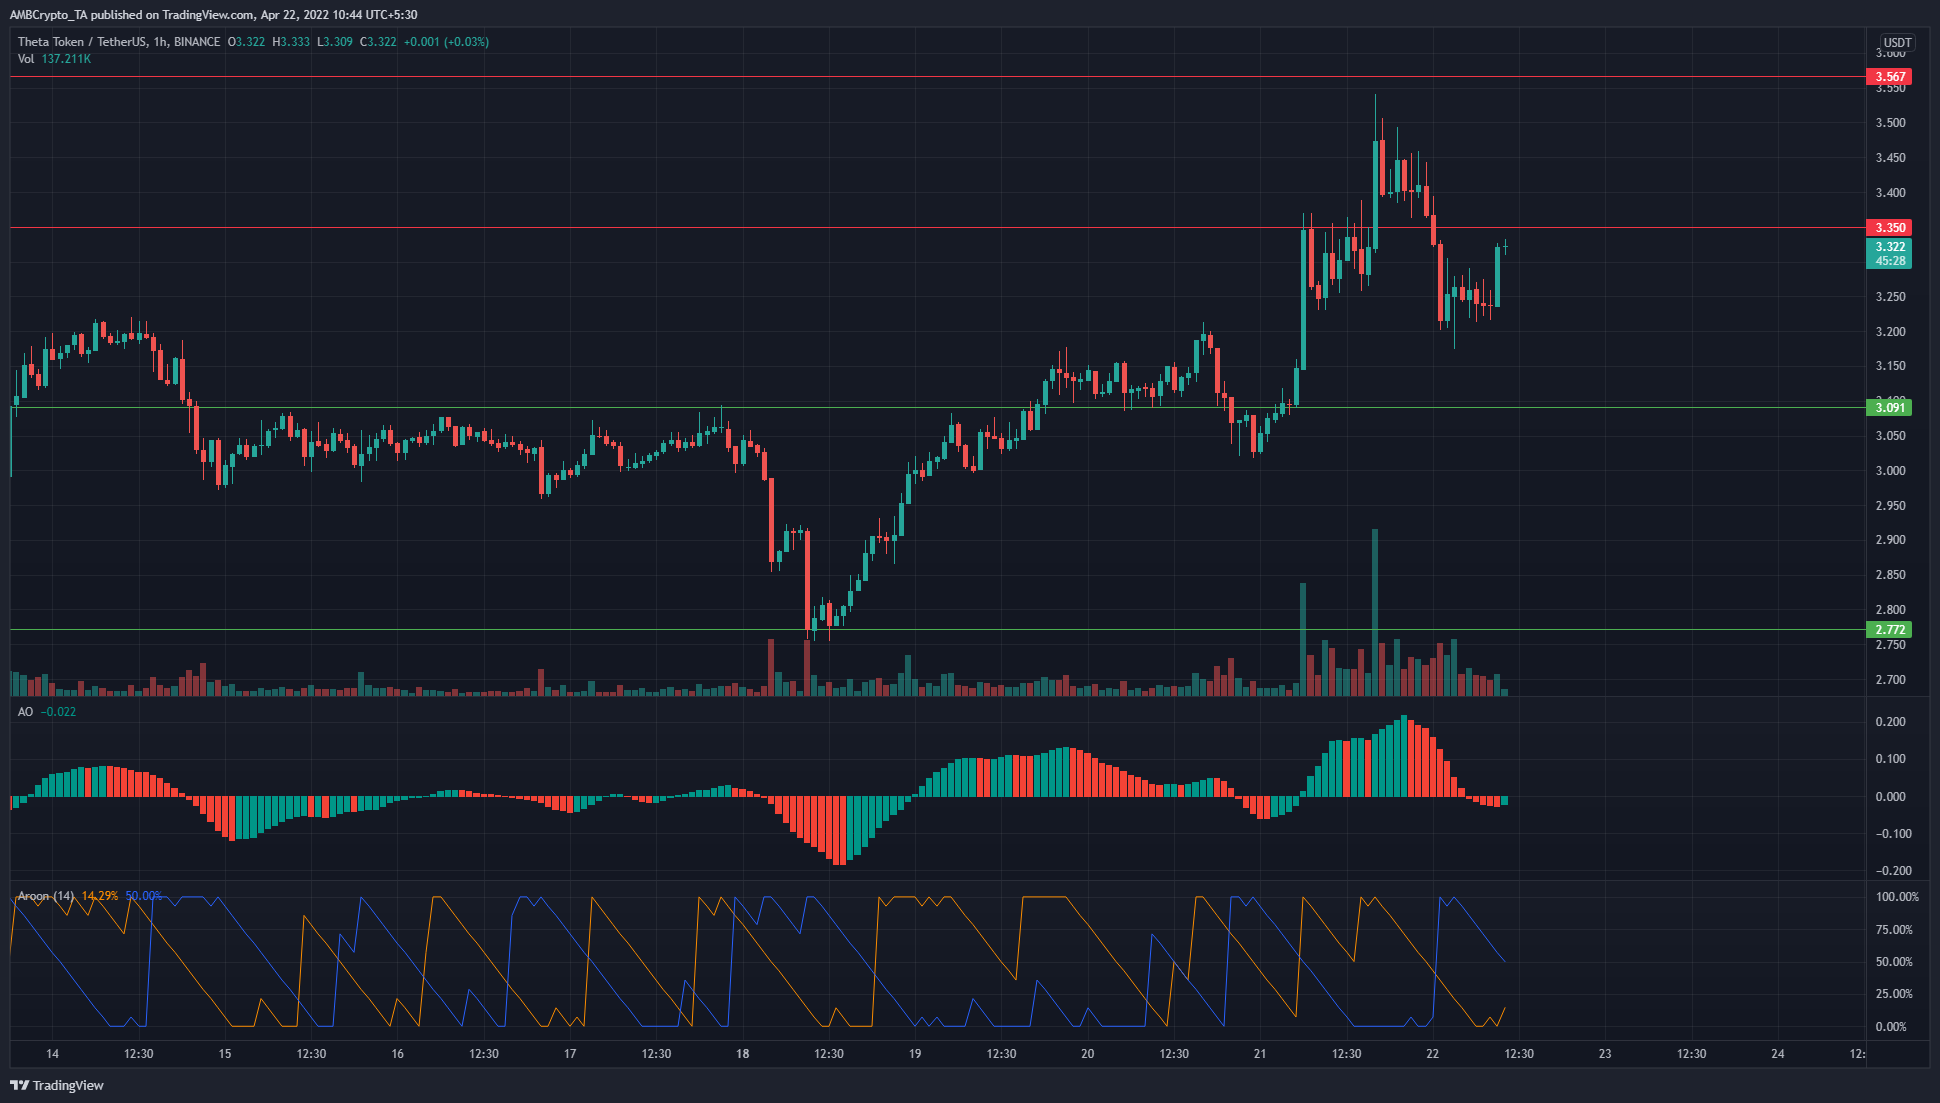
Theta had a short-term bullish market structure but this changed when it fell beneath the $3.25 level. The $3 level has been flipped to support over the past week, and at the time of writing, THETA bulls were fighting to drive prices past the $3.35 resistance level once again.
The Awesome Oscillator dipped below the zero line, and over the next day, further downside could be seen. The Aroon Indicator showed a downtrend in progress but the Aroon Down (blue) was dipping, to show waning bearishness. Hence, a dip to $3 could occur once more.
Terra (LUNA)
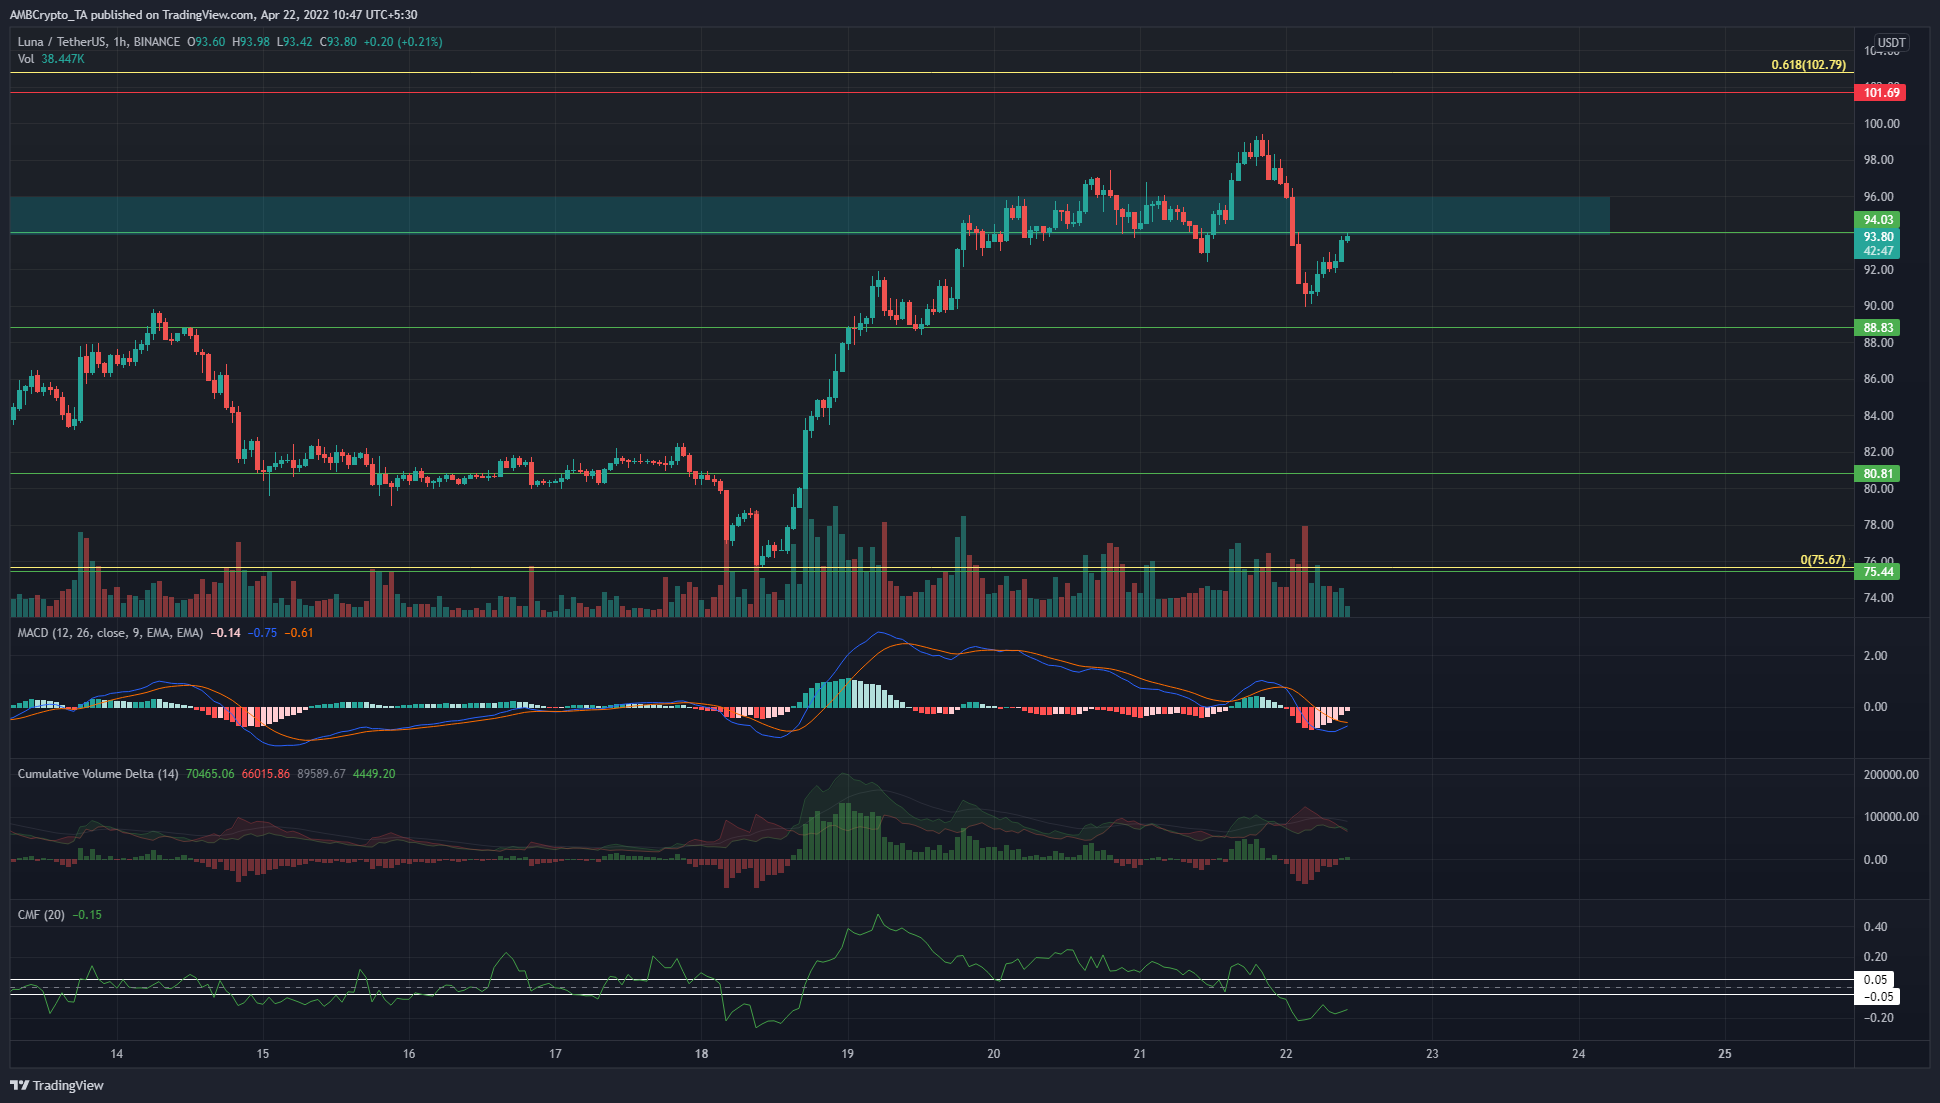
LUNA fell beneath the $95 zone of demand (cyan box) and could retest it in the next few hours. A rejection would confirm it has been flipped to a supply zone. The MACD fell beneath the zero line and showed a sell signal.
The CVD did post weak green bars to hint that maybe bulls had some strength. However, it appeared likely that LUNA would face rejection at $95 and a further drop, as the CMF showed strong selling pressure. It moved below -0.05 to suggest heavy capital flow out of the market.
On the other hand, if LUNA can close a session above $96, the short-term bias might begin to shift in the favor of the bulls.
FTX Token (FTT)
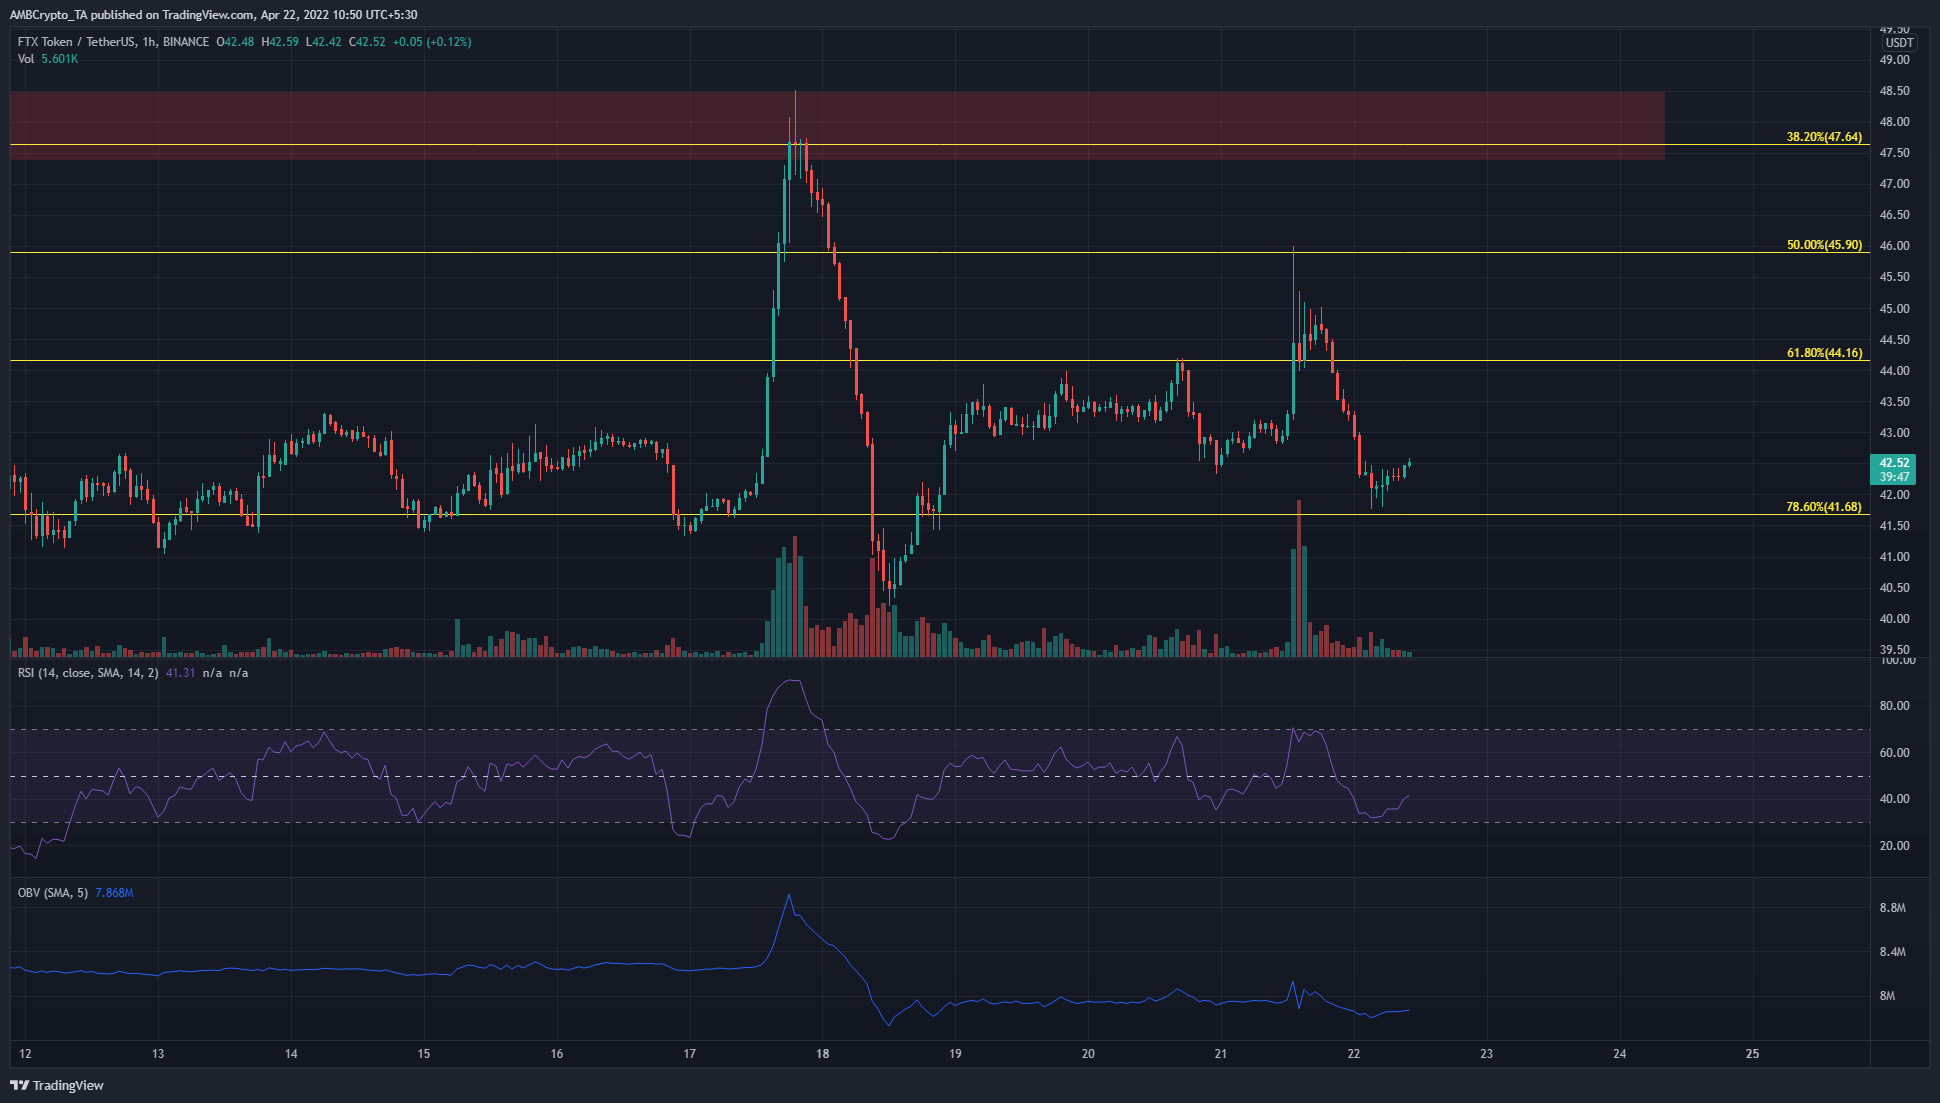
FTX Token has seen strong volatility in the past few days. Based on its move from $38.52 to $53.28, a set of Fibonacci retracement levels (yellow) was plotted. At the time of writing, the 78.6% level has been defended.
However, the OBV was in a downtrend to show selling volume outweighed buying volume. The RSI was also beneath the zero line, to show bearish momentum. The $43-$43.5 could pose stiff resistance to FTT.


