
Amid widespread fears that Bitcoin’s bull run was officially over, it managed to break above $34k on Tuesday. The asset rallied by 10% over the past week and was trading at $34,745 at the time of writing. Many are of the opinion that Elon Musk’s appearance at the “B-Word” event was the catalyst for this recovery. BTC shot up by 8% right after it.
The price hike has nonetheless left many analysts hopeful once more. In a recent video, popular analyst Benjamin Cowen expressed his own bullish sentiments. While he had mentioned in a video just last week that “we are technically still in a downtrend”, in his latest he opined,
“We are very close to breaking the downtrend on the price.”
Why so bullish?
First of all, as per the chart below, BTC was finally testing the 50-day Simple Moving Average (SMA), for the first time since mid-May. It had earlier been tested in January and March when the line was acting as a support. Since then, after a failed breakout attempt in May, the candlesticks had remained below the line.
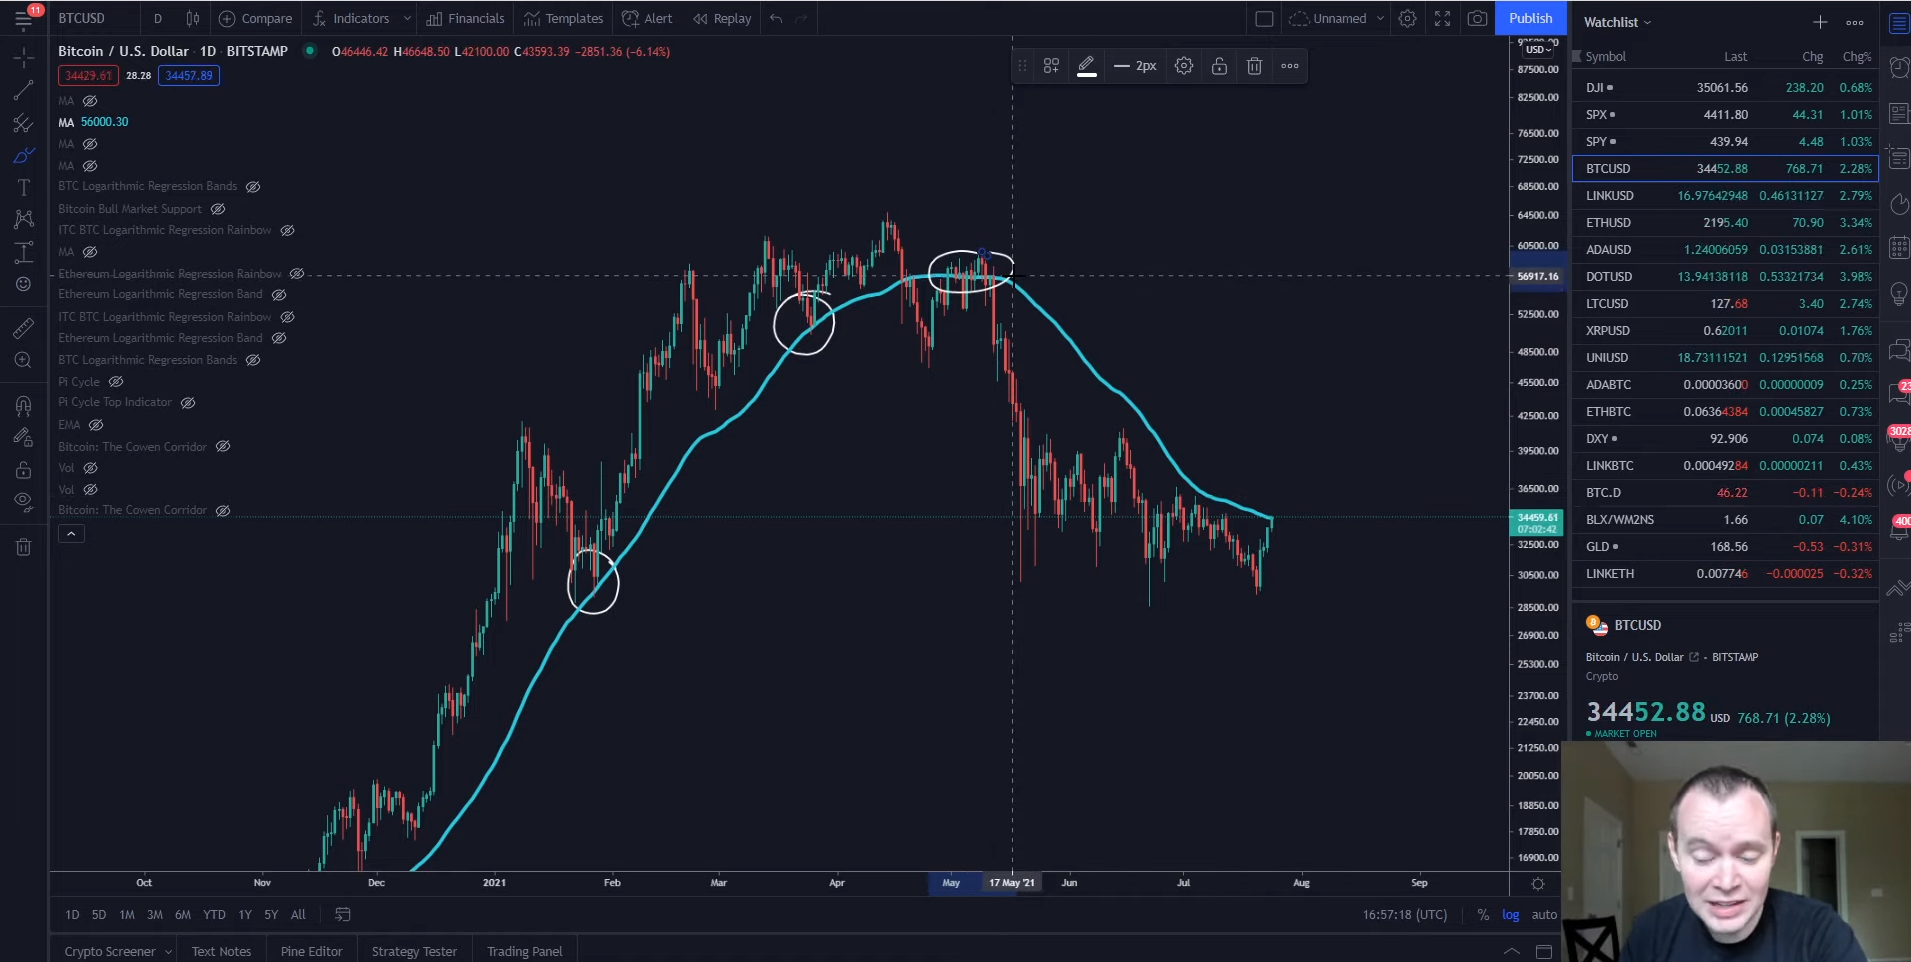
Source: Youtube/Benjamin Cowen
Other indicators similarly pointed towards a possible breakout. For instance, Bitcoin’s 4-hour chart showed a breakout from the downtrend that it was following since May. While Cowen mentioned that this did not mean that the coin would shoot straight back up to $60k due to this, it did give the bull’s a fighting chance.
Source: Youtube/ Benjamin Cowen
Renewed buy-pressure may do some good for the coin
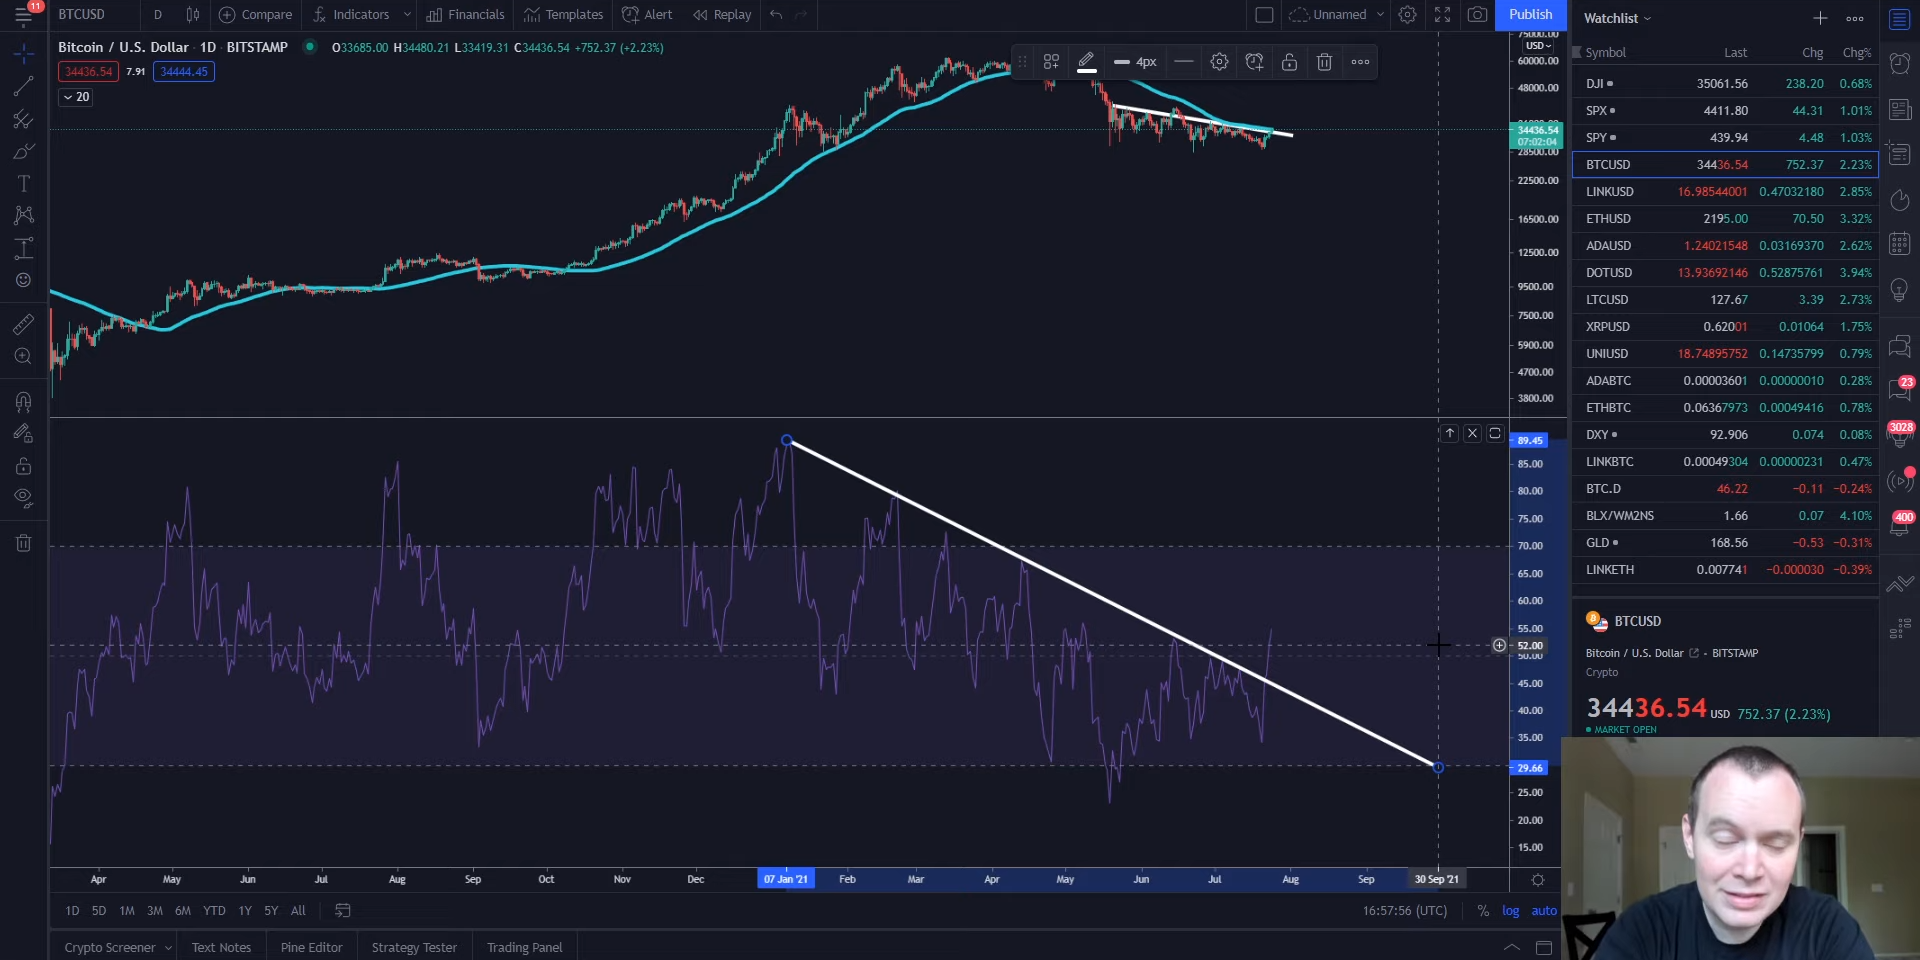
Similarly, the chart attached above showed that the bulls were their strongest in January when the coin was highly overbought. Since then, the Relative Strength Index (RSI) had been following a straight downtrend on the 1-day chart as sell-side pressure continued to dominate. This, however, was reversed recently when the indicator broke through the trend line, after almost 7 months.
In his previous video, Cowen had expressed dismay at the fact that even as BTC had touched upon new all-time highs earlier in the year, the RSI had just made lower highs corresponding to the price. Now, this breakout could be an essential signal towards renewed buy-pressure which could herald in price recovery.
Source: Youtube/Benjamin Cowen
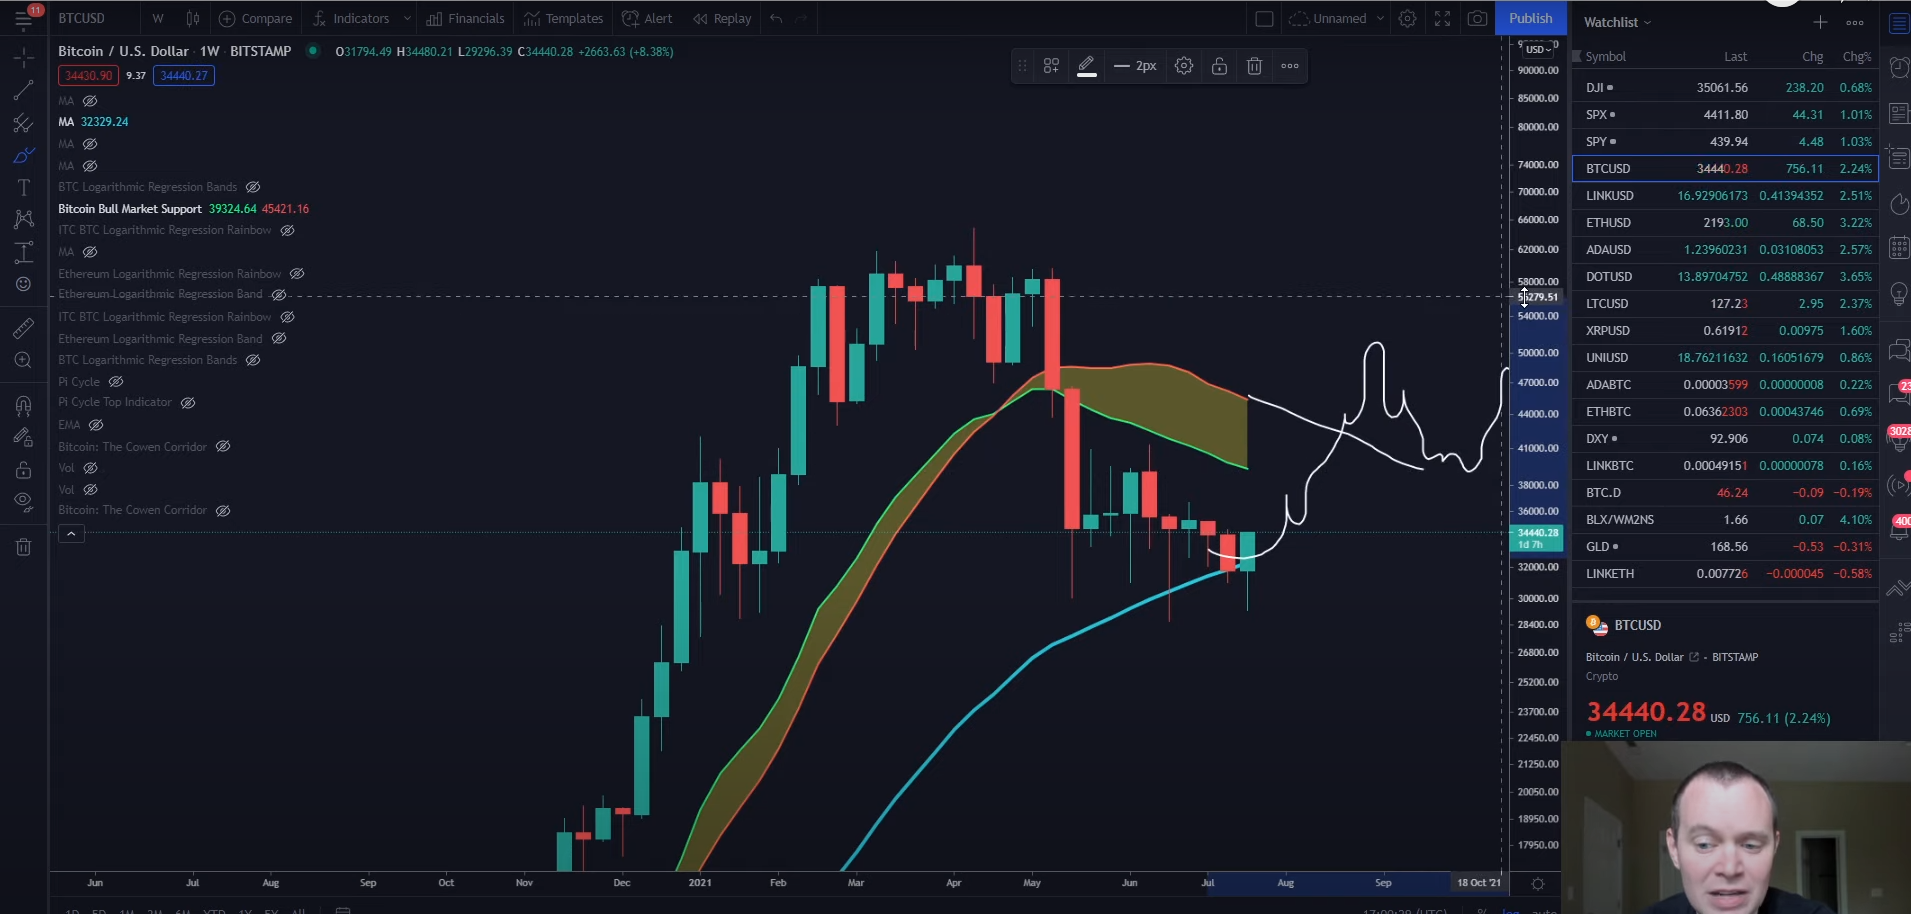
According to the analyst, while these indicators are definitely positive signs to “bring confidence back to the bulls”, it is the 20-week SMA that Bitcoin needs to get to, before the bull run can be resumed. The Bull Market Support band in the chart above is a combination of the 20-week SMA and 21-week exponential moving average (EMA).
According to Cowen, “what matters most” was breaking through the 20-week SMA which was at a far-away $45k. He further elaborated,
“We are still well away from the 20-week SMA. Remember, in order for us to get super bullish again about a six-figure bitcoin, what we would like to see would be for Bitcoin to go above the SMA, come back down, test it as support and then go up.”
Now, looking at this price hike and the subsequent reversal of an elongated downtrend, it would be hard to ignore that Bitcoin might indeed be headed for a potential bull rally once more.


