This Bitcoin fractal predicted the fall, but here’s the next price target

Bitcoin, along with the larger crypto-market, dropped the ball after the most recent price fall had echoes of 19 May’s crash. With BTC shedding 25% of its value in a matter of a few hours, the market seemed to reset to its September-end levels. While it was trading around the $49k-mark at press time, for a brief moment, it did tread close to $42,000 too.
The aforementioned price fall led to a mass wipeout, giving way to over $2.5 billion liquidations across the market. Ergo, the question – Does the macro bullish outlook for Bitcoin remain intact?
The dip was overdue
On the daily chart, Bitcoin’s price had been in a falling wedge structure since the 16 November crash. Looking at the larger structure for the past month, it can be argued that the latest crash to the $42k level was overdue.
On zooming out, a look at BTC’s weekly chart highlighted how after the 4 December crash, the price broke the MA 50 trend-line.
During the previous major corrections too, the price had broken below this level in May and then again, in late June. However, it has always managed to hold it.
In fact, this level has acted as a support for the +100% rally from July to November. Thus, as long as the weekly closes above or at least around the 1W MA50, BTCUSD has a legitimate probability of forming support there and starting a new rally.
Interestingly, an RSI fractal seemed also to be in play here. As noted in the chart above, a similar RSI structure was seen from mid-2019 to early 2020, as seen from early 2021 to the time of writing. The key catalyst in both cases was the sell-off due to COVID fears.
However, this crash was more of a combination of multiple factors like the panic among retail investors, tech market crash, over-leveraged crypto-markets, high Open Interest, positive funding rate, and so on.
So, what’s next?
For now, while the price has rebounded, another fall to the lower $40k-level cannot be discarded.
However, BTC’s two main utility indicators continue to rise – A good signal. BTC’s token circulation and its daily active addresses, at press time, sat at a 6-month high. In fact, they seemed likely to continue their uptrend too.

Source: Sanbase
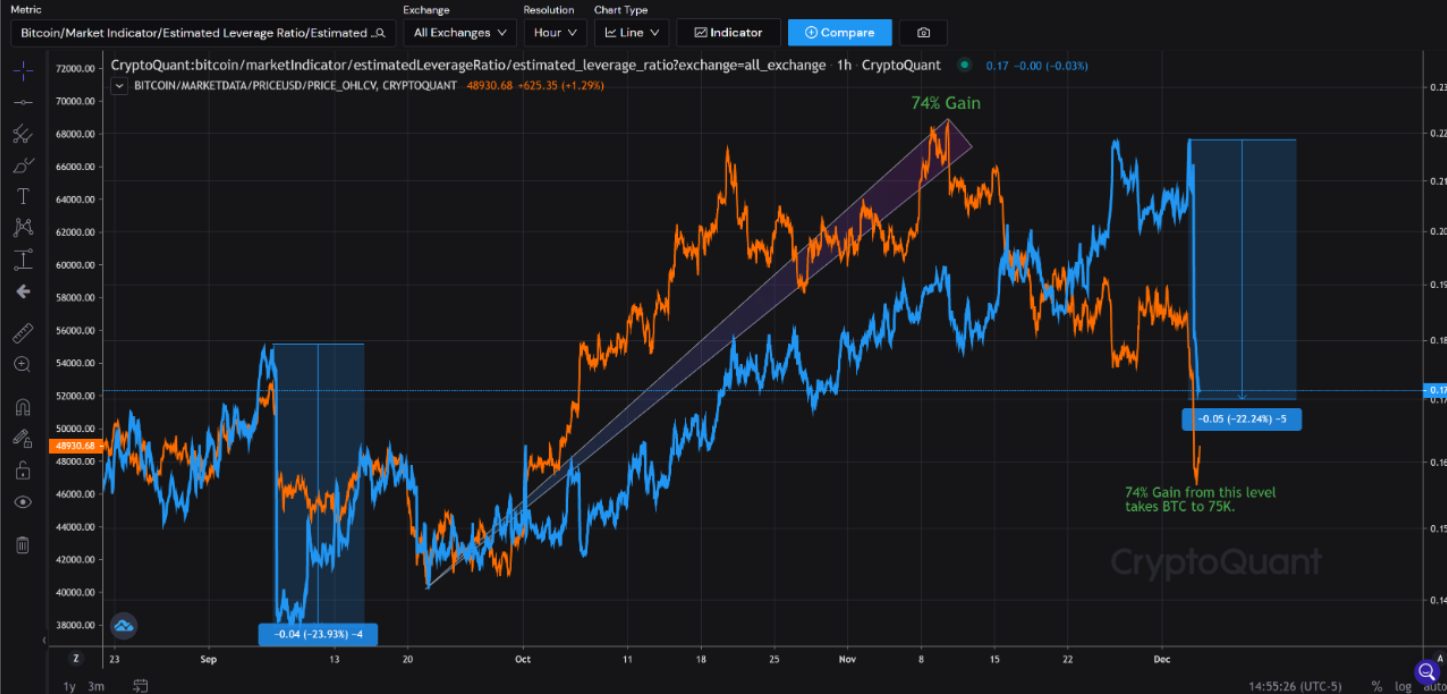
Furthermore, the estimated leverage ratio dropped by 22% in just one day. This was last seen in September when the price dropped by 24% and touched $40k.
In case a similar rally follows and BTC’s price makes a similar structure, the next minimum target of $75k for Bitcoin towards the end of January 2022 can be expected.

Source: CryptoQuant
At the time of writing, the biggest takeaway as BTC’s price rebounded from its lower levels seemed to be that the market dynamics have been looking very different than previous cycles.
Even though volatility was still high, the market seemed to move from FOMO-induced price tops and sell-offs to more mature and sustainable growth while flushing leverage. Nonetheless, with the price structure still tilting towards bearish, despite the bounce, it would be best to be cautious.


