This could trigger another sell-off for XRP

XRP’s value was also recovering with the top two cryptocurrencies, Bitcoin and Ethereum. The digital asset ranked seventh on the CoinMarketCap list with a market capitalization of $31.38 billion and traded at $0.6787, after a 5% appreciation over the past 24 hours.
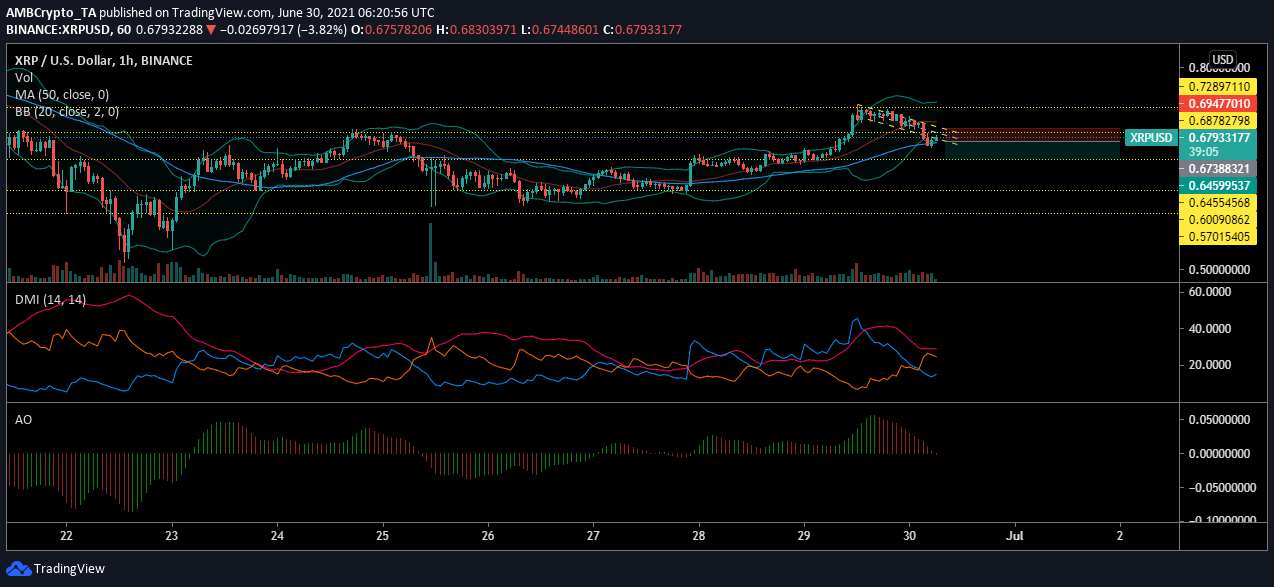
XRP hourly chart

Source: XRPUSD on TradingView
The above chart highlighted that XRP broke out of consolidation and hit resistance at $0.7289. The asset rejected this price level and trended lower, forming a descending channel. The channel was broken once the price hit support at $0.6878, after which a sell-off was triggered.
The XRP value dropped as low as $0.6668 after where it found support and reversed. As XRP’s price tried to recover once again, bearishness prevailed in the market. This bearishness could push the value further down to $0.6455.
Reasoning
The XRP market was highly volatile when the price surged on 29th June. Even though volatility reduced with the falling price of the asset, it has not yet left the market. The signal line surpassed the price bars when the value depreciated; this pushed the market towards the bearish zone.
However, the falling price received support from the 50 Moving Average which was right under the candlesticks. The MA remained under the candlesticks and could be put to test as the selling pressure rises. As per Awesome Oscillator indicator, the XRP market had already hit the bearish momentum and was rising. Meanwhile, downward pressure was growing as the -DI crossed over the +DI during the correction phase.
At the time of writing, XRP was testing resistance at $0.6878 and if it fails to breach it, another sell-off could be triggered.
Crucial levels
Entry-level: $0.6738
Take Profit: $6459
Stop-level: $6947
Risk and Reward: 1.34
Conclusion
Although correcting from the recent fall, the XRP market remained in the trenches. The asset tested resistance at $0.6878 and a failure to breach this level could trigger holders to sell the digital asset and realize profits.


