This is what Polkadot [DOT]’s latest formation means for traders

Disclaimer: The findings of the following analysis are the sole opinions of the writer and should not be considered investment advice.
Polkadot [DOT] continued to trade within an incessant downtrend that stretched back all the way to November. There was some respite in February and March 2022, but the buying pressure was smothered as the market turned fearful in April. At the time of writing, Bitcoin [BTC] was in the midst of a move upward. It surged straight past the $20.7k resistance, with the next level of importance sitting at $23k.
DOT- 12-Hour Chart
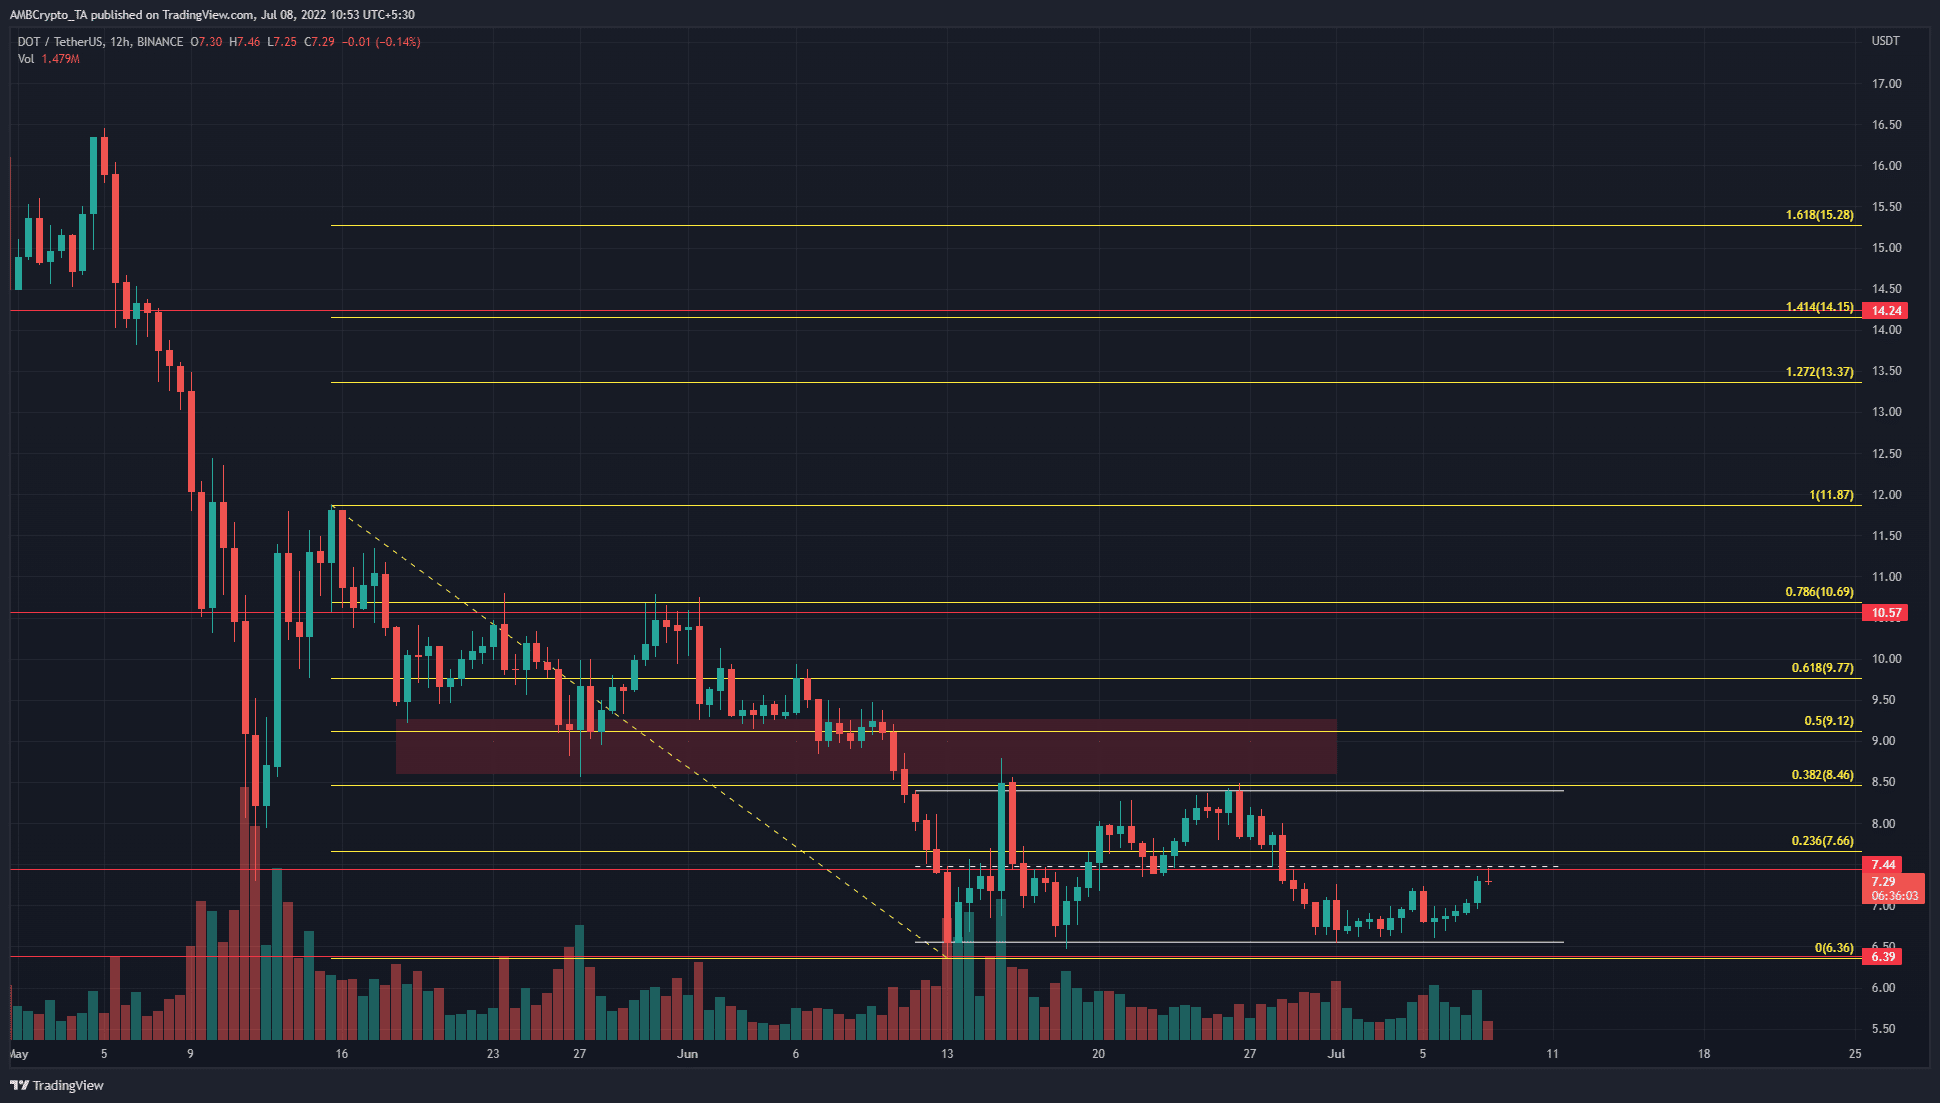
Polkadot has been on a downtrend since early April, following a rejection from the $23 mark. The price has set a series of lower highs since then, characteristic of a downtrend. This downtrend remained unbroken.
Using the swing high and swing low at $11.87 and $6.36 respectively, Fibonacci retracement levels were plotted (yellow). Generally, the 38.2% retracement level poses stiff resistance. If this level can be flipped to support after a move down, the asset can be expected to climb toward the 61.8% level, which would be the next strong resistance level.
For Polkadot, things were a little bit more complicated. The coin has already been rejected twice from the 38.6% retracement level at $8.46. The price was trading between $6.4 and $8.4 over the past month and indicated a range formation. The mid-point of this range lay at $7.45, which was also a long-term horizontal level of significance. Moreover, the 23.6% retracement level was quite close at $7.66.
Rationale
Based on the price action, we can see that the $7.5 and $8.4 areas would offer high resistance to a move upward. To add credence to this idea, the indicators also had a bearish bias.
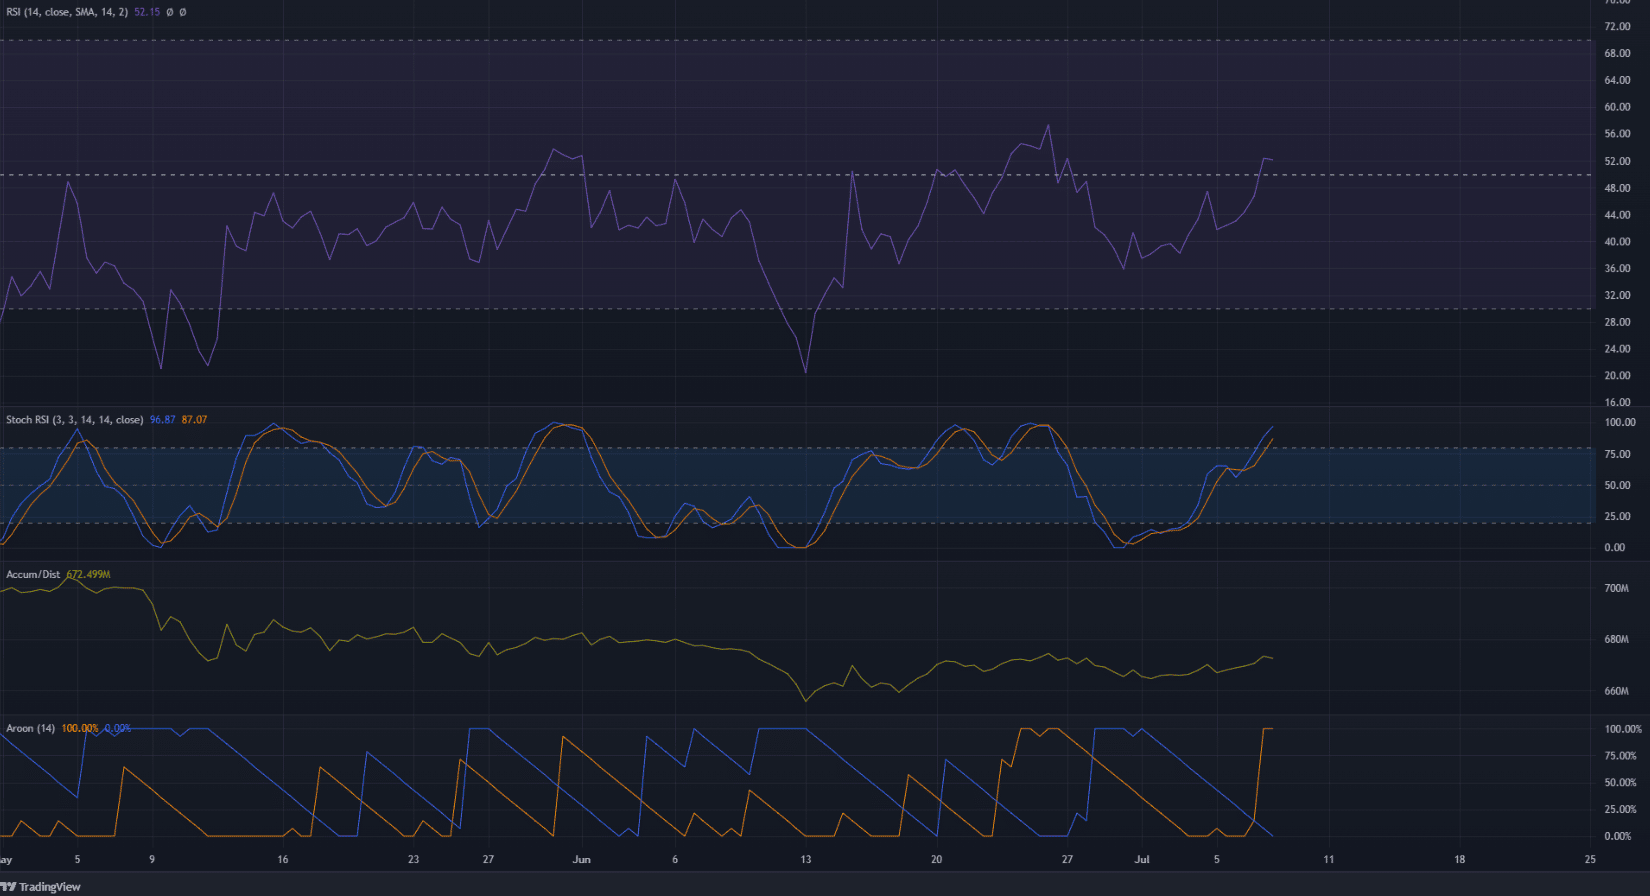
The Relative Strength Index (RSI) struggled to climb past the neutral 50 level and stay above it. It has been below neutral 50 since early April, to confirm the strength of the bearish trend behind Polkadot since then. The Stochastic RSI was once more in the overbought territory, while the A/D line pushed weakly northward.
This lackluster push upward hinted at weak buying pressure. Even though the Aroon Oscillator showed an upward move to be imminent, the rest of the indicators emphasized that sellers remained dominant.
Conclusion
The formation of a range meant that traders could wait for the lows to be retested to consider buying DOT. Buying at the mid-range could be risky, but aggressive traders could seek to position themselves long if the $7.5 area was flipped to support.


