This is why DeFi’s growth in 2021 isn’t a fluke

Despite corrections setting in, Bitcoin, at the time of writing, was trading at just over $47,500. Further down the crypto-ladder, Ethereum, the world’s largest altcoin, was valued at $1,850 on the charts. Needless to say, the industry’s top-two cryptos holding positions near their ATH levels is cause for optimism.
For all the market’s bullish sentiment, however, both cryptos look unlikely to replicate the staggering pace of growth seen towards the start of the year. Instead, the two cryptocurrencies are more likely to go on a consolidatory run on the price charts. What does this mean? Well, because the likes of Bitcoin and Ethereum have often been rangebound after hitting ATHs thanks to their cyclical price movements, other more profitable avenues can be explored by traders.
DeFi can be one such profitable avenue, especially since investment flows into the space have already started to come in. Now, one look at the price charts would reveal that since the year 2021 dawned, DeFi tokens have outperformed most of the market, including the likes of Bitcoin and Ethereum. However, is a look at the price charts enough, especially for a sector that has often been branded “high risk, high reward.”
The answer, it’s really not. And, not because it’s DeFi, but because it is due diligence. Ergo, what is required is a serious look at the metrics that are fueling the performances of the DeFi sector and its tokens.
Why metrics?
Why do we need to look at on-chain metrics though? Well, because more often than not, on-chain metrics best explain the price movement of an asset or a market. And, in the unlikely case where they don’t, the asset’s price often levels offs to where it was previously.
Consider the example of Bitcoin’s hike a few weeks ago. No not the Tesla-fueled one, but the “Elon Musk updated his Twitter bio” one. Right before the world’s largest cryptocurrency surged up the charts, a majority of its technical indicators and metrics were flashing bearish signals. Whether it was the Exchange Whale Ratio or the Miners to Exchanges transaction count, each one of them suggested that a hike wasn’t forthcoming.
And yet, BTC did hike. Later, within hours, the cryptocurrency reverted to type, trading within the range it was trading in before the said pump. Why? Well, because the metrics didn’t back it.
This is the reason why if you’re an investor or a trader, the on-chain metrics associated with every likely “profitable avenue” need to be explored.
Why DeFi’s growth isn’t a fluke
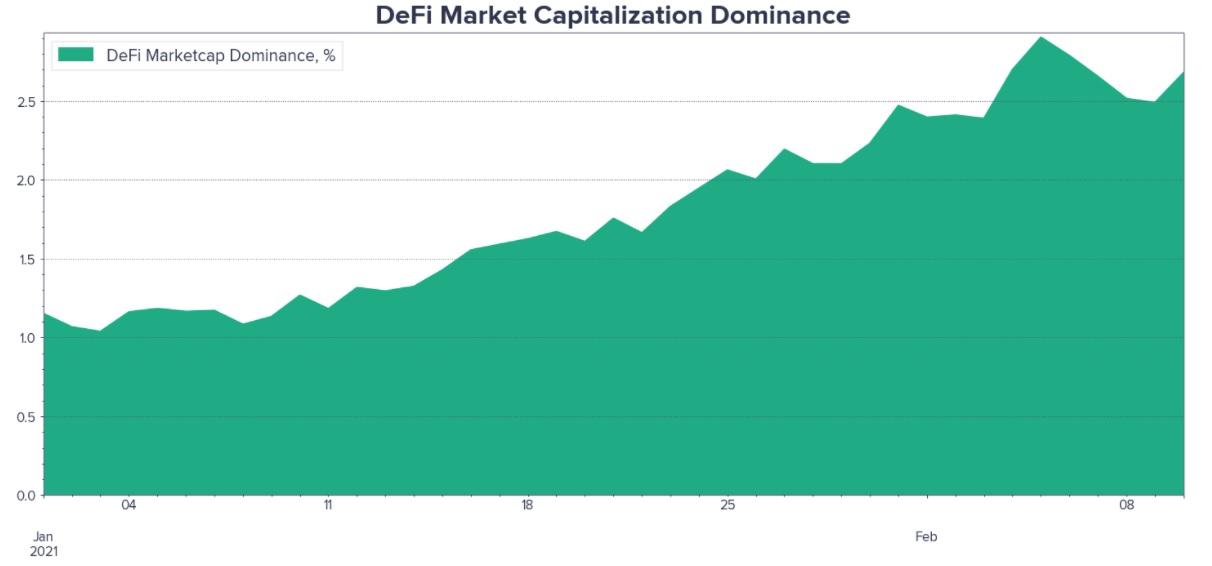
Let’s look into DeFi then, and let’s start with the most basic – Market Cap. According to Santiment, since the start of 2021, the market cap dominance of all DeFi coins has risen to 2.7% from 1.2%. What’s more, “DeFi blue chips like UNI and AAVE – coins that didn’t even exist a year ago – now sit comfortably among the top 20 biggest coins by market cap.”
The growth in the sector was highlighted by the surge in Daily Active Addresses this year as well, with the combined DAA for the market’s top-12 DeFi coins climbing from 20,000 at the start of the year to 35,000 on the 10th of February – a 75% growth. Interestingly, what is also worth noting here is that while the prices of almost all DeFi tokens have risen over the last 40-odd days, the DAA for MKR and YFI have plateaued of late.
MKR and YFI are “not pulling their weight,” the crypto-analytics platform noted.
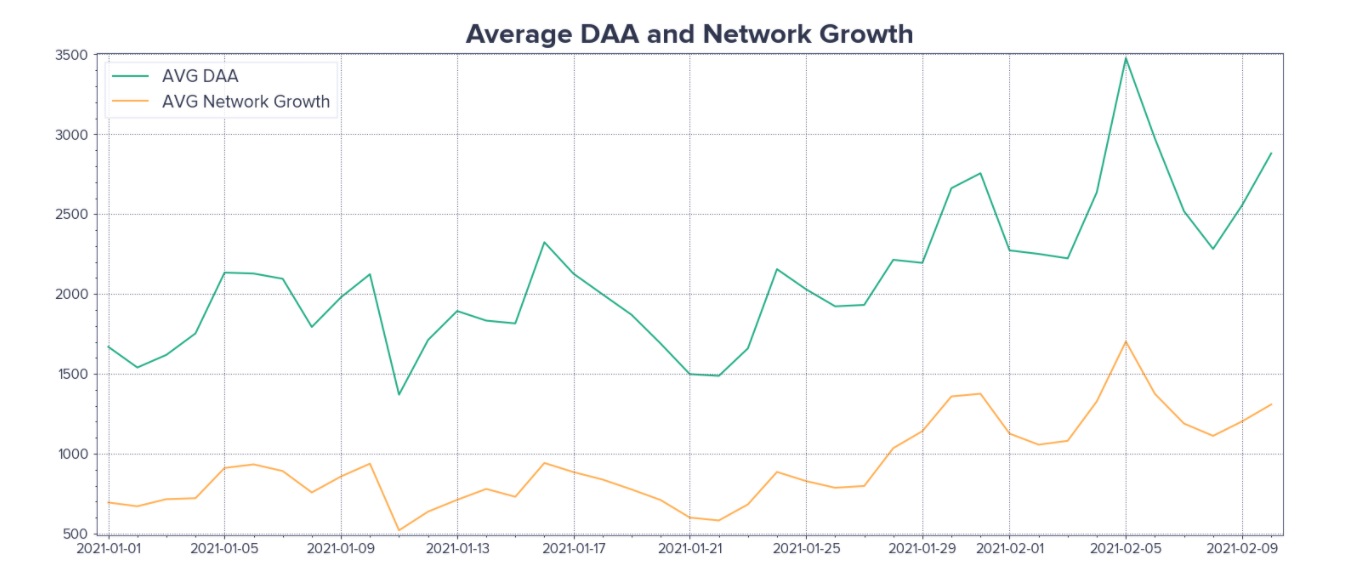
The said improvement was visible on the DeFi coins’ Network Growth chart as well, with the averages of both DAA and Network Growth climbing since January 2021, with a peak noted on the 5th of February.
Even on other counts, the DeFi sector’s performance is noteworthy, with the percentage of supply on exchanges falling over the past few months. Ordinarily, a fall in the mean and median supply of an asset on exchanges is a sign of falling sell-pressure. This is the case this time too, with the implication being that thanks to these DeFi coins’ price performance, HODLing is taking flight in this sector of the market too.

It should be noted, however, that the MVRV painted a more ambivalent picture. While the said metric for the crypto-market’s top DeFi coins has been on a high lately, the finding implied that short-term and long-term holders will be more likely to sell their assets “if market sentiment sours.”
What do these findings prove? Simply put, they prove that the DeFi sector’s growth is built on solid fundamentals and powered by bullish on-chain metrics. Contrary to the hike that followed Musk’s Twitter bio update, DeFi’s growth this year isn’t going to fizzle into thin air. Ergo, as an investment opportunity, the space might be worth looking at again.