This may severely impact Cardano’s upward trajectory

Although a few candlewicks rose above the $3-mark, Cardano was yet to register a daily close above $2.96. In fact, the world’s third largest digital asset was now taking shape within a descending wedge and the same was expected to severely impact ADA’s upwards trajectory.
Bearish signs settled on a few of its indicators and buyers needed to target a key price level to avoid a bearish outcome. At the time of writing, ADA traded at $2.94, down by 1.3% over the last 24 hours.
Cardano 12-hour Chart
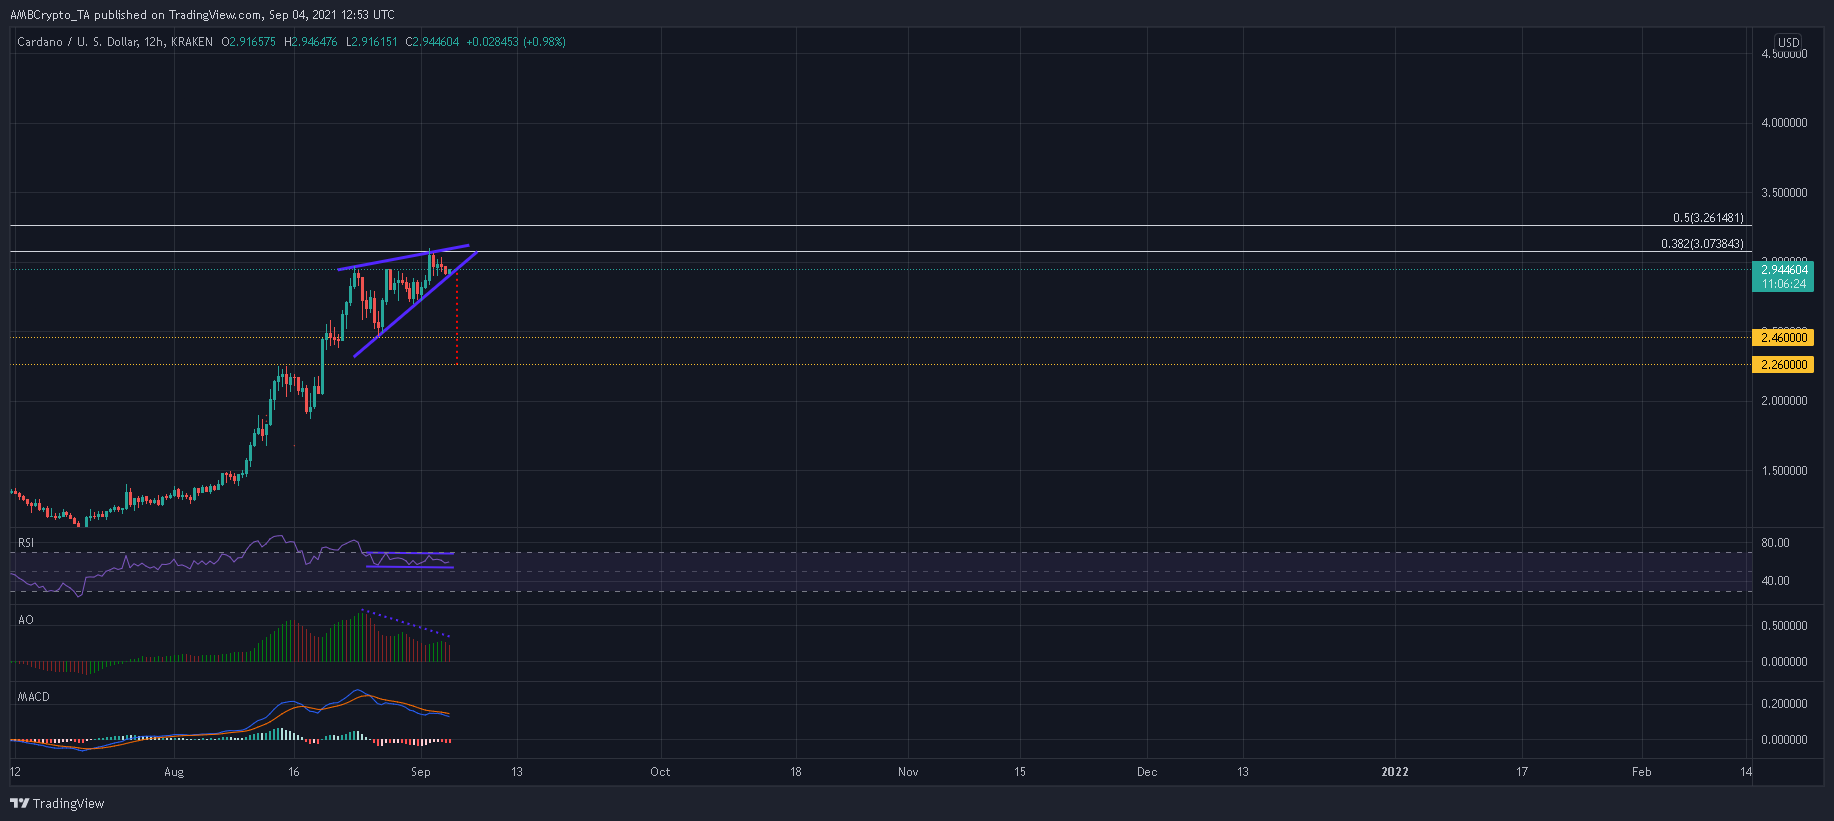
The 12-hour chart indicated that prices have moved within a descending wedge since 23 August. The setup is usually considered bearish and the same was expected to function as a reversal of ADA’s previous uptrend.
A breakdown would set price targets around $2.25, which would result in a 23% plummet in value from ADA’s press time level. An early cut-off can also be expected at $2.46, which now functioned as support.
On the other hand, support found at $2.90 would allow ADA to continue movement within the pattern but a breakdown was expected nevertheless. To negate this bearish structure, ADA would need to close above $3.1 with strong volumes.
This outcome would allow ADA to assert itself at higher levels without fears of an immediate pullback. A broader market rally would also have a positive impact in the ADA market.
Reasoning
Several divergences were spotted across ADA’s indicators. The Awesome Oscillator formed three lower peaks as buying pressure lost steam. The index was also in danger of a sharp drop below the half-line due to a bearish twin peak setup. The MACD was also on a constant decline since 23rd August.
The Signal line stayed above the fast-moving line, something that is normally observed when bearish momentum starts to rise. Meanwhile, the RSI was a bit of a saving grace. The index steadied from overbought levels one week ago, and moved in a horizontal channel above 50. ADA’s overall uptrend would be under no immediate danger till the RSI dips below 40.
Conclusion
ADA’s ascending wedge exposed the market to a 23% decline. A few indicators declined from multi-month highs and flashed bearish signals. However, an RSI reading above 55 meant that an extended sell-off was unlikely due to the presence of underlying bullish strength in the market.