This new entry trigger in TRON can prove to be quite profitable

Disclaimer: The findings of the following analysis are the sole opinions of the writer and should not be considered investment advice
Tron (TRX) has been on a long-term downtrend since declining from the $0.129-mark. Nevertheless, the bulls managed to find their grounds over the last month. The alt saw a close above the vital 38.2% Fibonacci resistance over the last day.
After firmly retesting the upper band of the Bollinger Bands (BB), TRX could set itself up for a drop towards the $0.062-$0.063 range before continuing its up-rally. At press time, TRX traded at $0.06393, up by 1.27% in the last 24 hours.
TRX 4-hour Chart
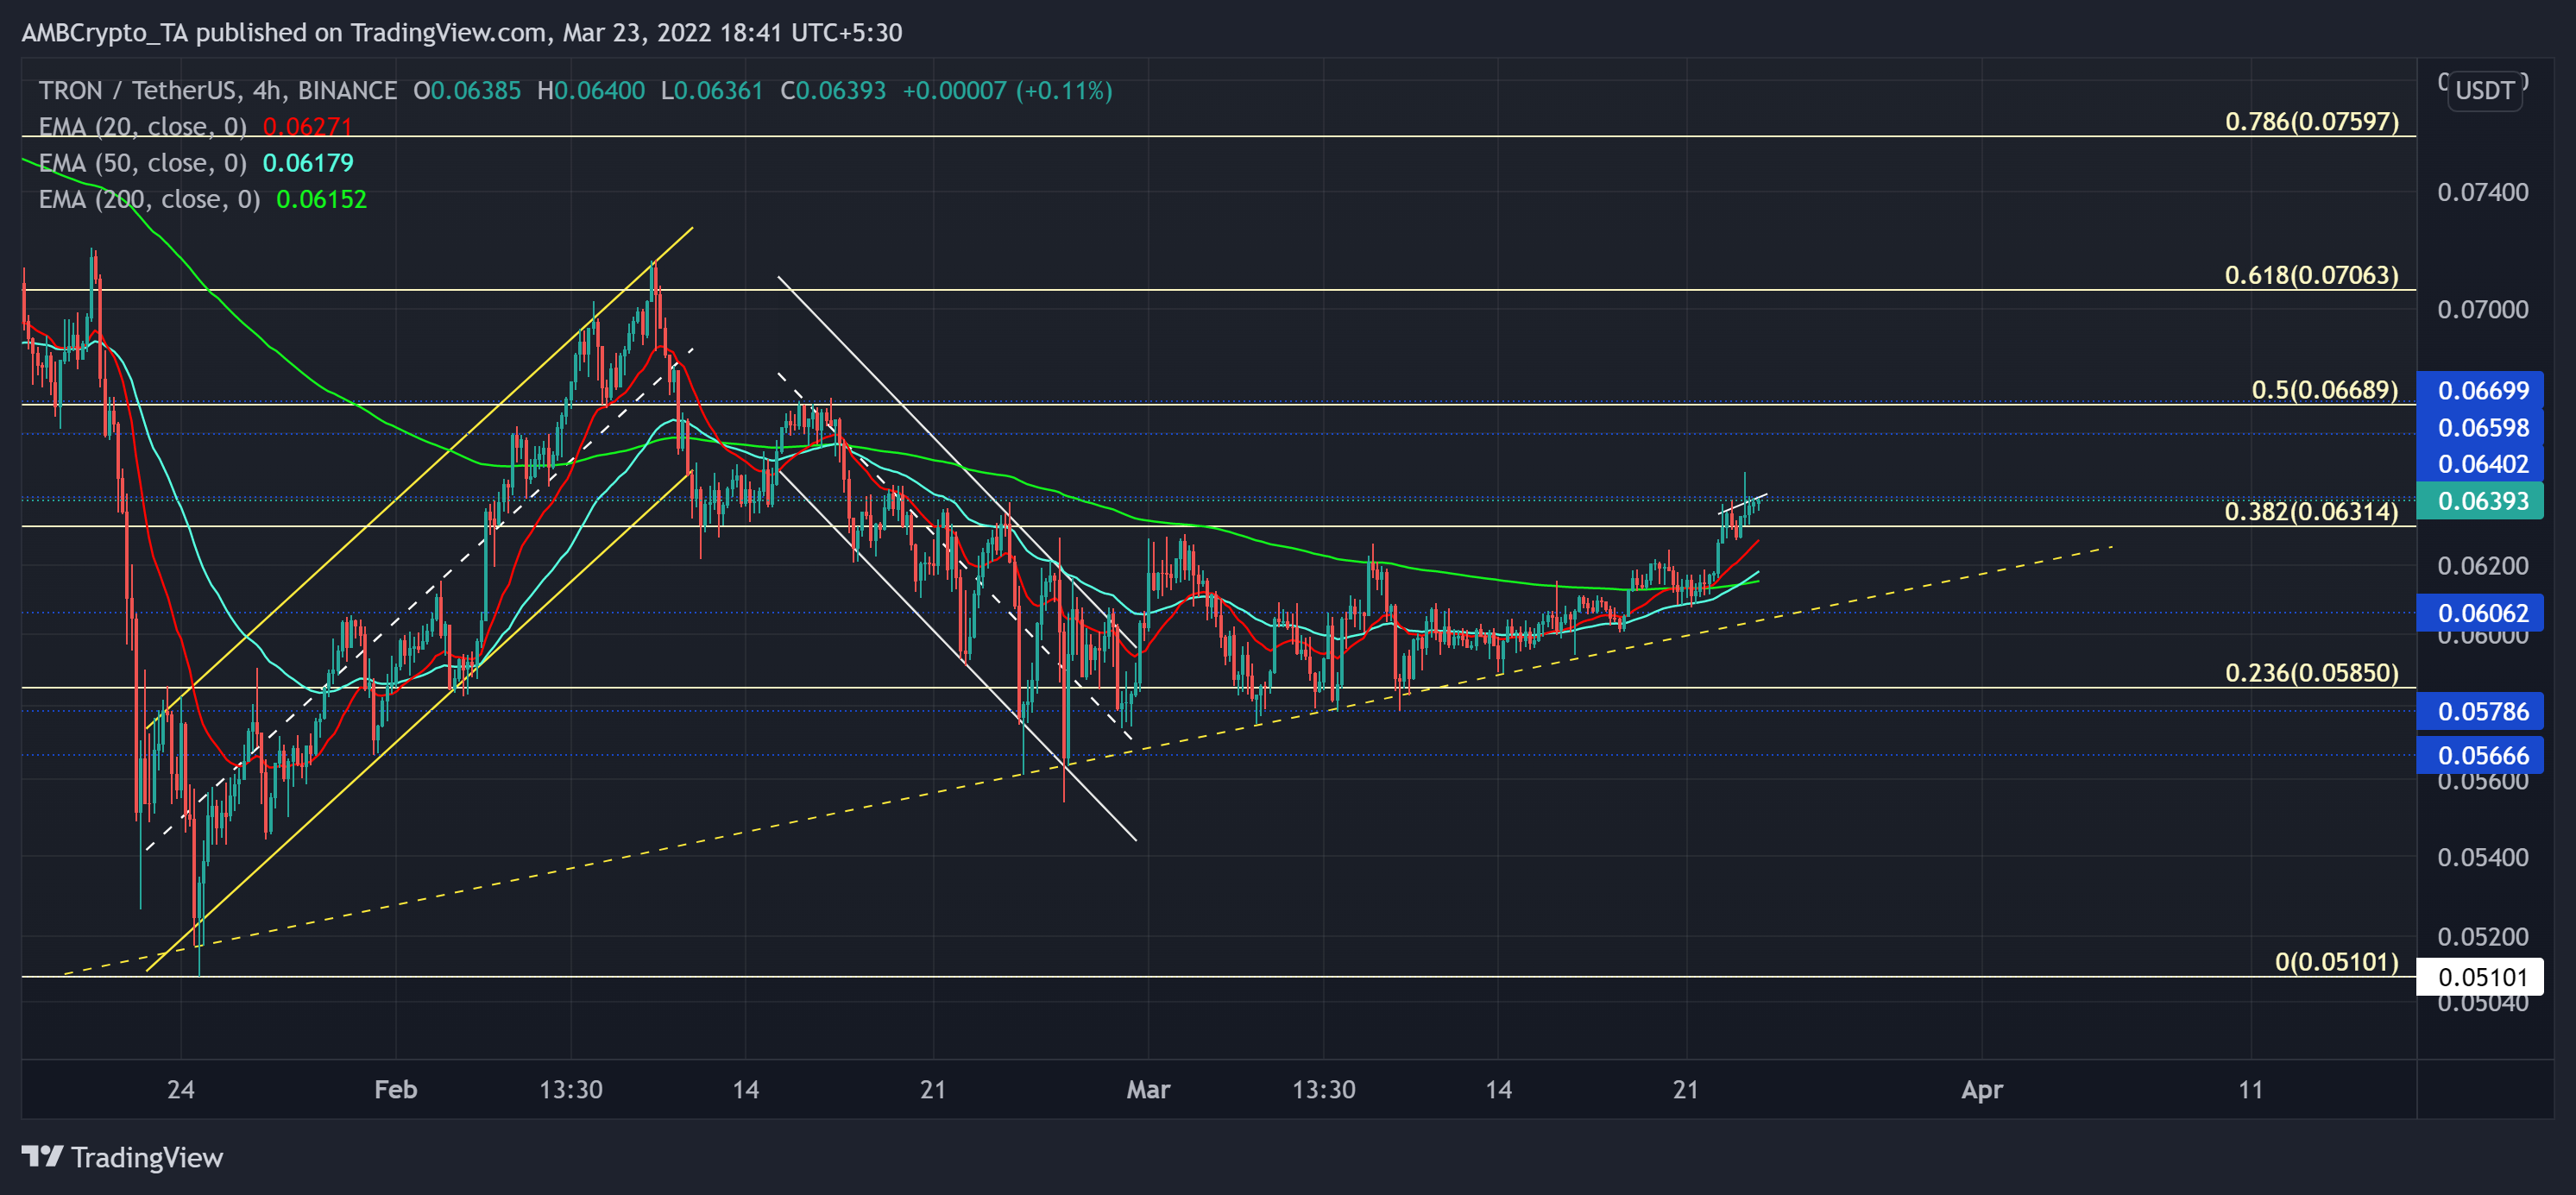
Since its November highs, TRX substantially depreciated (over 60%) and plunged towards its six-month low on 24 January. Since then, the bulls took charge of the troughs, as evidenced by its trendline support (yellow, dashed).
It registered nearly 40% gains to retest the 61.8% Fibonacci resistance on 10 February. Since testing the golden level, TRX took a downturn while the 23.6% level and the trendline offered support. Over the past day, bulls found a close above the critical 38.2% resistance whilst the 20 EMA (red) and 50 EMA (cyan) crossed the 200 EMA (green). Thus, revealing a golden cross on its 4-hour chart.
Owing to the recent golden cross and the sturdiness of its immediate support, TRX would likely continue its uptrend and aim to overturn the $0.064-level. But before that, the alt could likely face a short-term setback towards 20 EMA as the price was still on the ‘expensive’ side of the Bollinger Bands.
Rationale
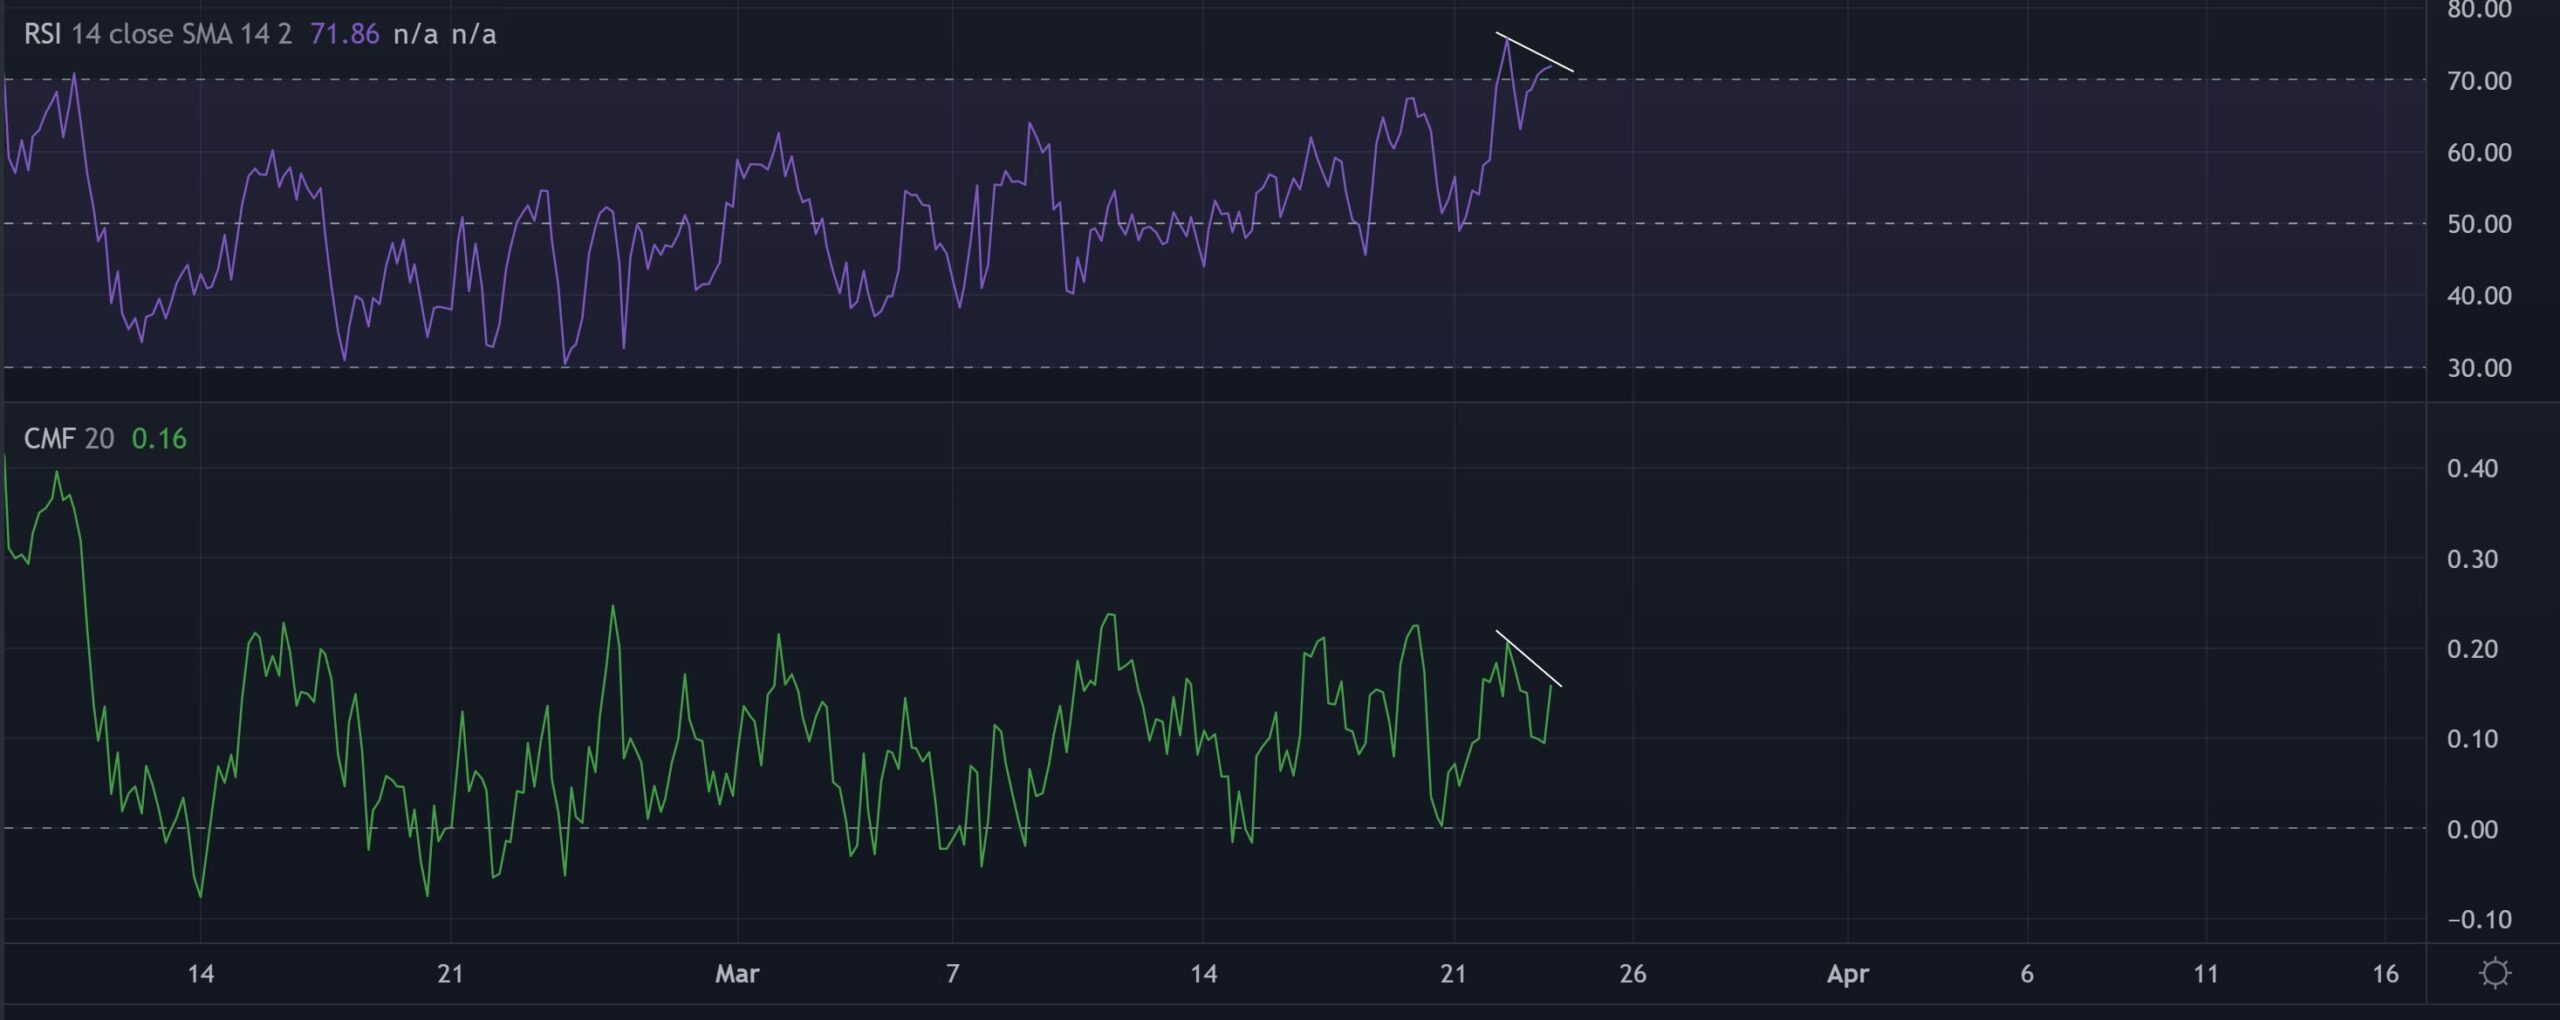
The RSI was into the overbought region as the bulls were on the driving seat. A fall from its trendline resistance would affirm a bearish divergence with price and cause a near-term pullback.
Similarly, the CMF was way above the zero-line and revealed a one-sided bullish momentum. A reversal from its resistance would confirm a potential bearish divergence with price.
Conclusion
Considering the overbought readings on the RSI and BB, a near-term setback towards the 20 EMA could be likely before TRX continued its uptrend. A strong close above its immediate resistance could open up recovery gates towards the $0.66-zone.
Moreover, the investors/traders should consider Bitcoin’s movement and its impact on broader market perception to make a profitable move.