This presents major hurdle for Solana, on its way to $300

Following a rebound from the lower trendline of a descending channel, Solana projected its next pit-stop around the $290-mark. A convincing close above the daily 20-SMA (red) would provide confirmation of the favorable outlook and an extension towards the 461.8% Fibonacci level.
Should SOL falter at the mid-line of its pattern, the 300% Fibonacci level would take center stage once again. At the time of writing, SOL traded at $214.7, up by 5% over the last 24 hours.
Solana Daily Chart
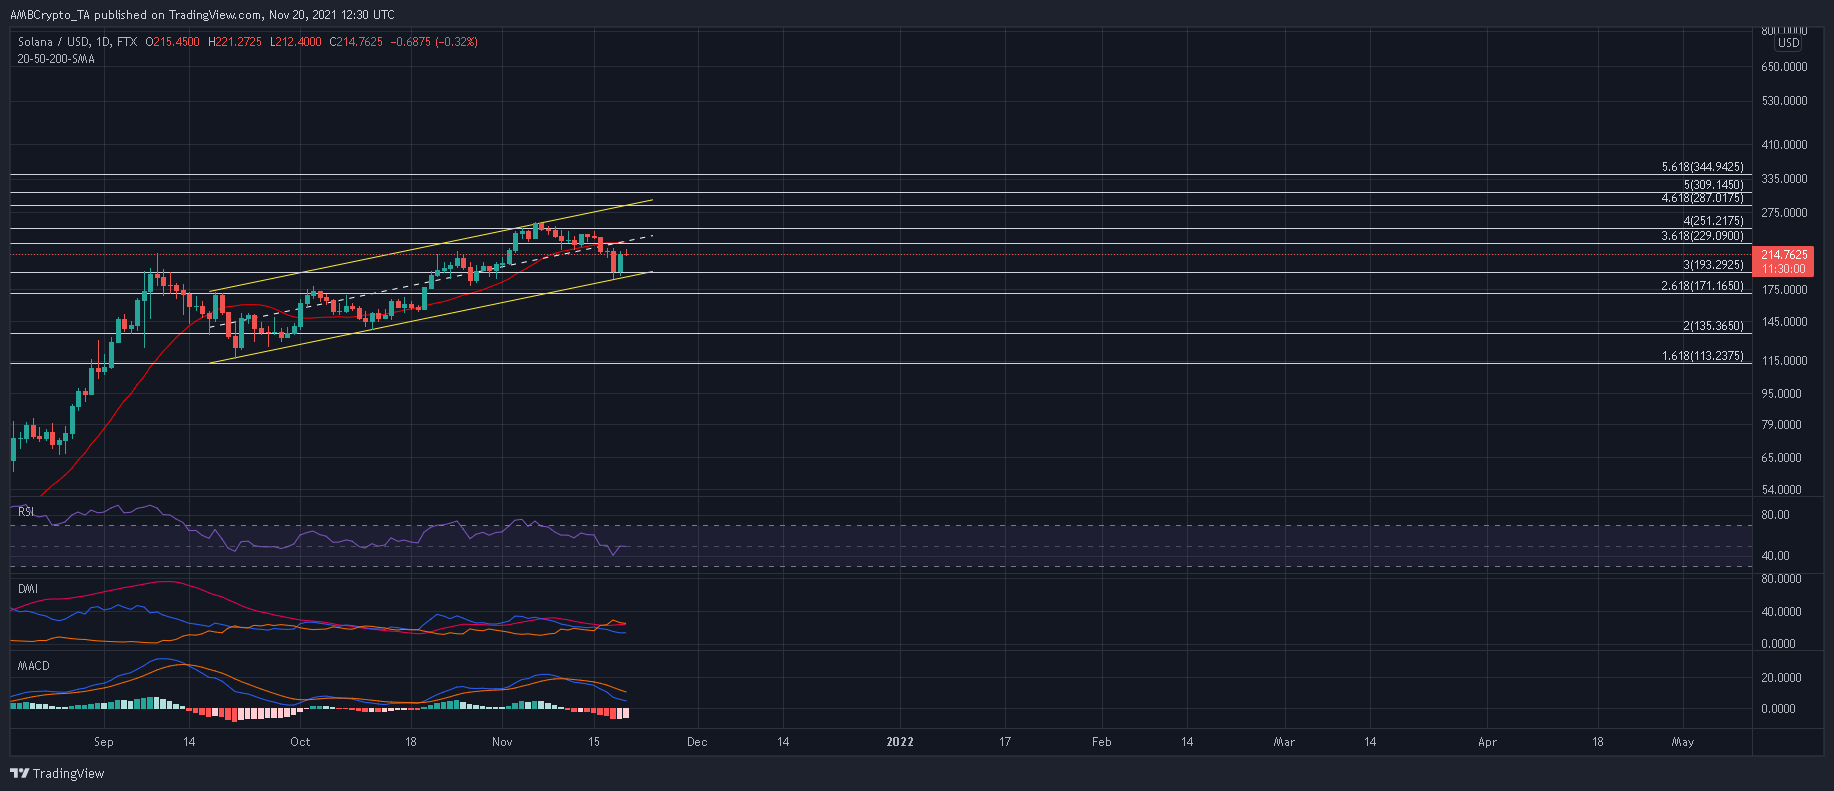
Two higher highs at $153 and $260 combined with three higher lows at $115, $137 and $188 outlined an up-channel on Solana’s daily chart. Presently, stabilization was in effect after a breakdown was averted on 19 November once SOL tested the bottom trendline for the third time in nearly a month.
This was backed by the RSI which held around its 50 and a MACD which highlighted receding bearish momentum. Should SOL now strengthens above the 20-SMA (red) and mid-line of its pattern, the next high would be formed at the 461.8% Fibonacci level.
The 500% and 561.8% Fibonacci Extensions would fall immediately in case SOL gathers strong buy volumes above the $300-mark. On the flip side, SOL would threaten a fourth retest of its bottom trendline should bulls fail to overturn the confluence of its 20-SMA (red) and 361.8% Fibonacci level.
The 300% Fibonacci level could be key during the next drawdown and would defend an extended sell-off. The 200% and 161.8% Fibonacci levels at $135.36 and $113.2, respectively, could be called upon if bears assume market control.
Reasoning
The daily RSI was yet to establish a position below 40 and maintained neutrality between buyers and sellers. Meanwhile, the MACD suggested that bears were losing grip as the index approached a potential bullish crossover. However, the DMI was unfazed by such developments and maintained a bearish bias.
Conclusion
SOL’s indicators were a bit of a mixed bag at the moment. Hence, until SOL can position a leg above the 20-SMA (red) and 361.8% Fibonacci Extension, long trades should be avoided. Once SOL does overturn the aforementioned zone, the next can be expected around the $287-mark. From there, an upwards breakout would instantly propel SOL above $300.