This support zone can maintain Chainlink’s bullish outlook

A series of higher highs and higher lows have set Chainlink up for success as it prepares for a decisive close above the 50% Fibonacci level. However, a risk-off broader market and MACD’s sell signal was expected to keep LINK grounded within a strong support zone before the breakout. At the time of writing, LINK traded at $29.9, down by 2% over the last 24 hours.
Chainlink 12-hour Chart
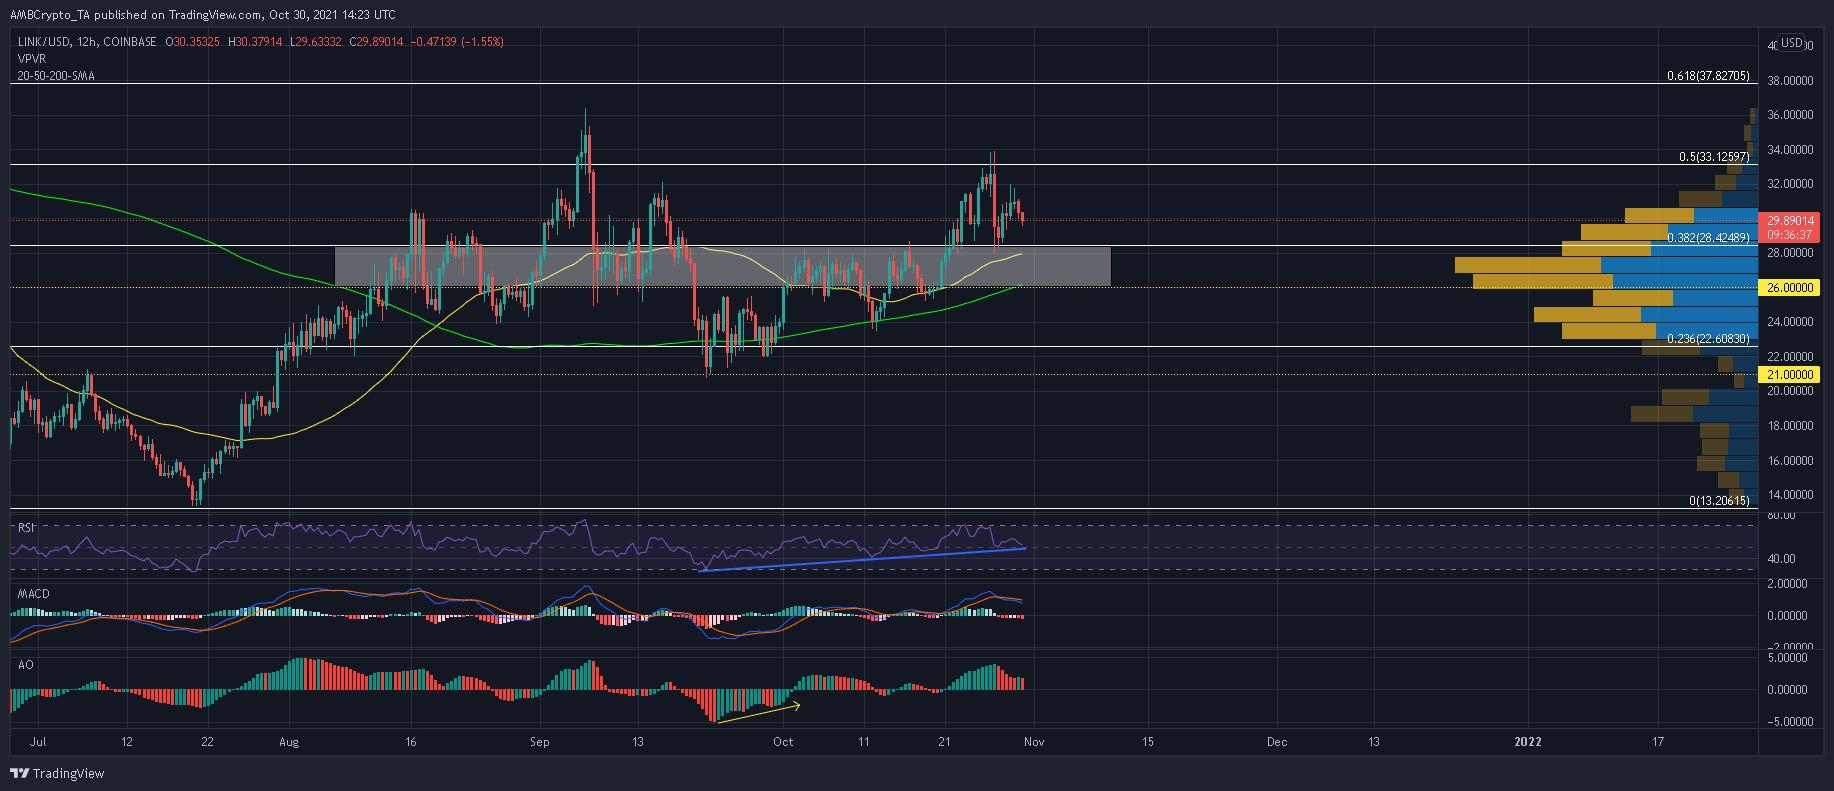
Higher highs at $25, $28 and $41.7 combined with lower highs at $23.6, $25.5 and $28.3 outlined LINK’s steady uptrend from 21 September. An extension of this trend would see LINK smash past the 50% Fibonacci level and challenge some shaky price ceilings above $33.
The Visible Range Profile indicated that LINK would traverse past a large chunk of selling pressure should its price gain a footing above $33.12. From there, expect the 61.8% and 78.6% Fibonacci levels be challenged with relative ease, although a double top at $36.5 would pose some bearish threats.
Now before LINK embarks on this projected run, there were some near-term hurdles that had to be dealt with. For instance, LINK was dangerously close of slipping below its 12-hour 20-SMA (red)- a development which would generate some additional sell pressure over the coming days.
Should sellers continue to react to MACD’s bearish crossover as well, LINK would retest its 38.2% Fibonacci level. Now, the presence of a reliable support at $26.6, combined with the 12-hour 50 (yellow) and 200 (green) SMA’s formed a solid defensive zone for LINK. The introduction of new longs within this zone would help counteract an extended decline.
Reasoning
LINK’s ling-term bullish thesis was backed by the RSI’s and Awesome Oscillator’s overall direction. The index has climbed steadily since late-September, respecting the boundaries of its lower trendline. Moreover, the Awesome Oscillator has largely traded above its half-line since forming bullish twin peaks last month. However, MACD’s bearish crossover on 27 October exposed LINK to some near-term weakness.
Conclusion
Before commencing a breakout above the 50% Fibonacci level, LINK needed to settle its losses above the $26-mark. The 38.2% Fibonacci level, along with the 50 and 200 SMA’s would ensure LINK’s bullish outlook and provide impetus for the next upcycle.