Toncoin price prediction – TON should beat THIS level to start an uptrend

- Toncoin has lagged behind the rest of the bullish market.
- It has a bearish structure and was trading below key moving averages.
Toncoin [TON] was up by 9.13% over the past week.
These would have been respectable numbers a few weeks ago, but the Bitcoin [BTC] breakout beyond $74k in the first week of November has induced extreme bullishness across the market.
It might seem like Toncoin is a good buying opportunity, since it hasn’t pumped yet.
Since it is a bull market, that can be true, but generally, the lack of movement while most other assets are bullish can also be a sign of weakness.
Toncoin price prediction
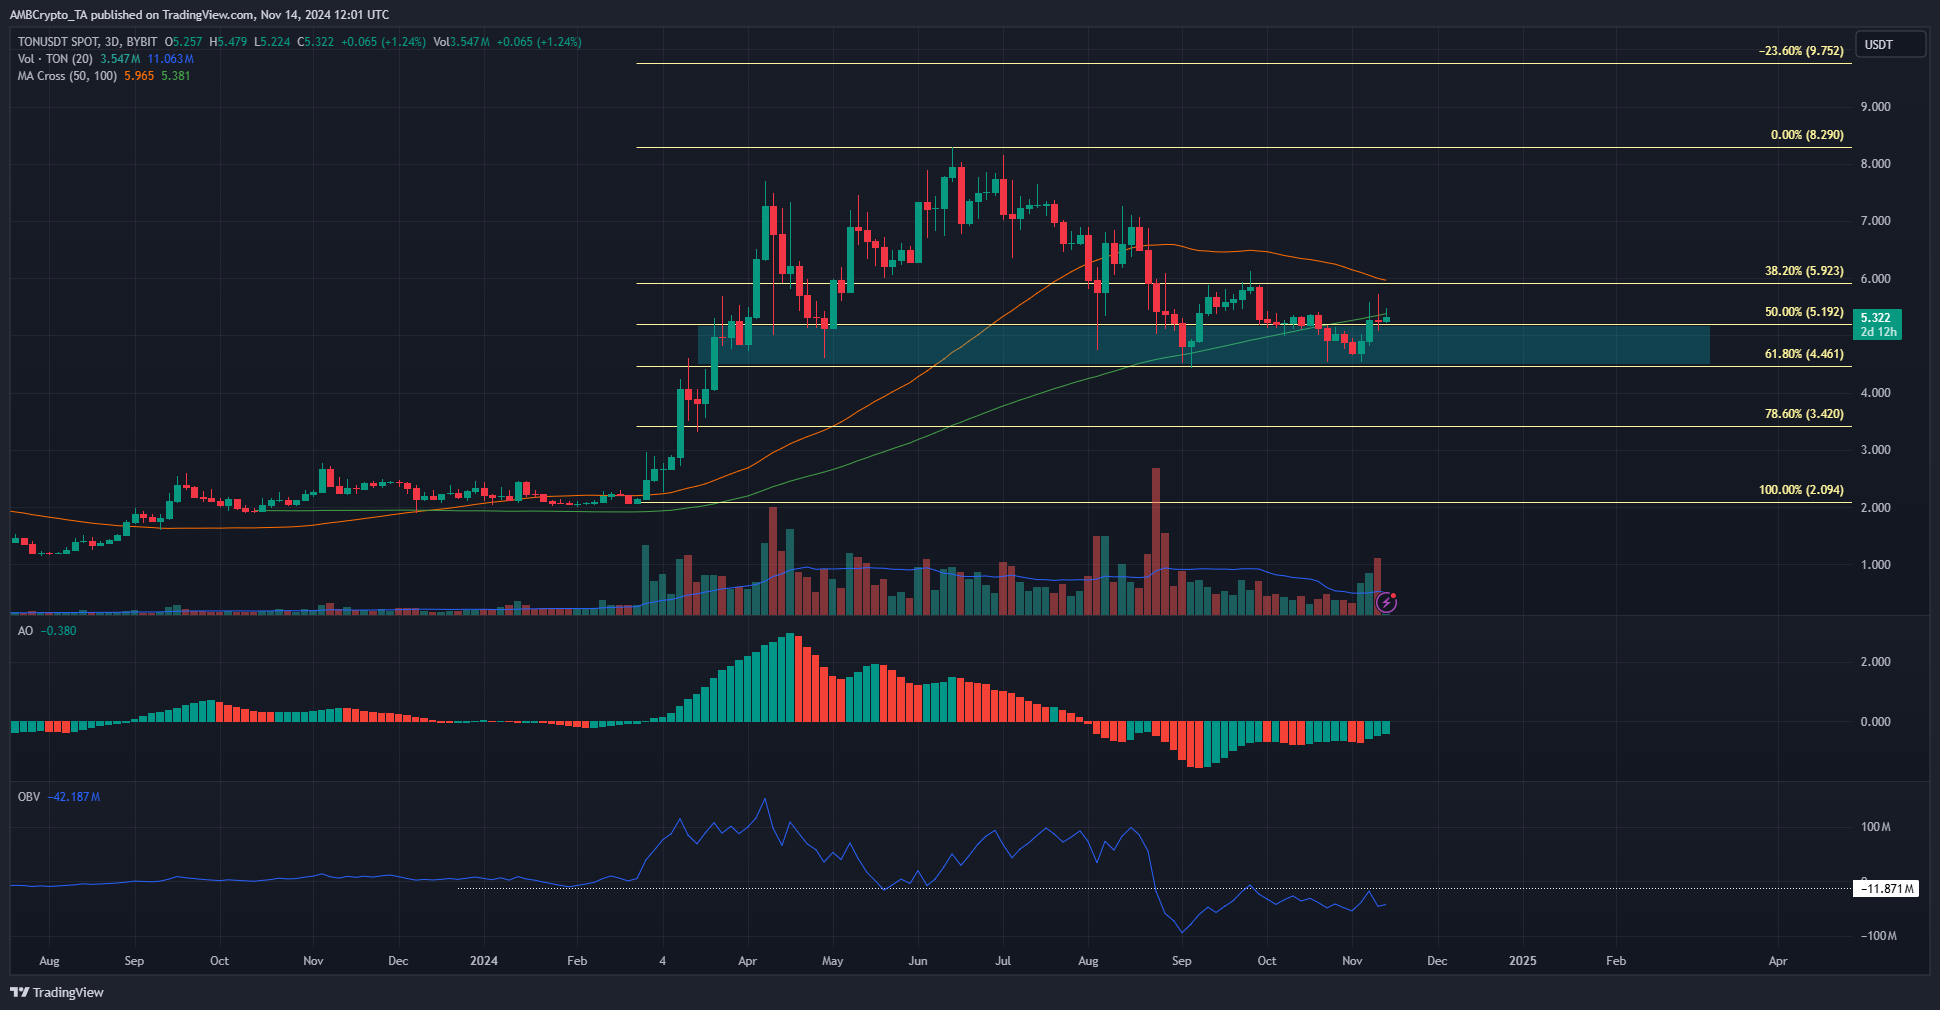
The momentum of TON has been bearish, according to the Awesome Oscillator on the daily chart. The green bars on the histogram signaled weakening bearish momentum, but the indicator was still below the zero line.
This was evident from the price action as well. The market structure was bearish, evidenced by the series of lower highs and lower lows seen since late July.
The OBV was also below a level that had been a support a few months ago. This suggested that the buying pressure has not taken control yet. A move beyond $5.92 would be the first sign of long-term bullishness.
The 50 and 100-period simple moving averages on the daily chart did not yet form a bearish crossover, but TON was trading beneath both of them. This was another sign of weakness in the market.
Magnetic zone could drive short-term gains

Source: Coinglass
Is your portfolio green? Check out the TON Profit Calculator
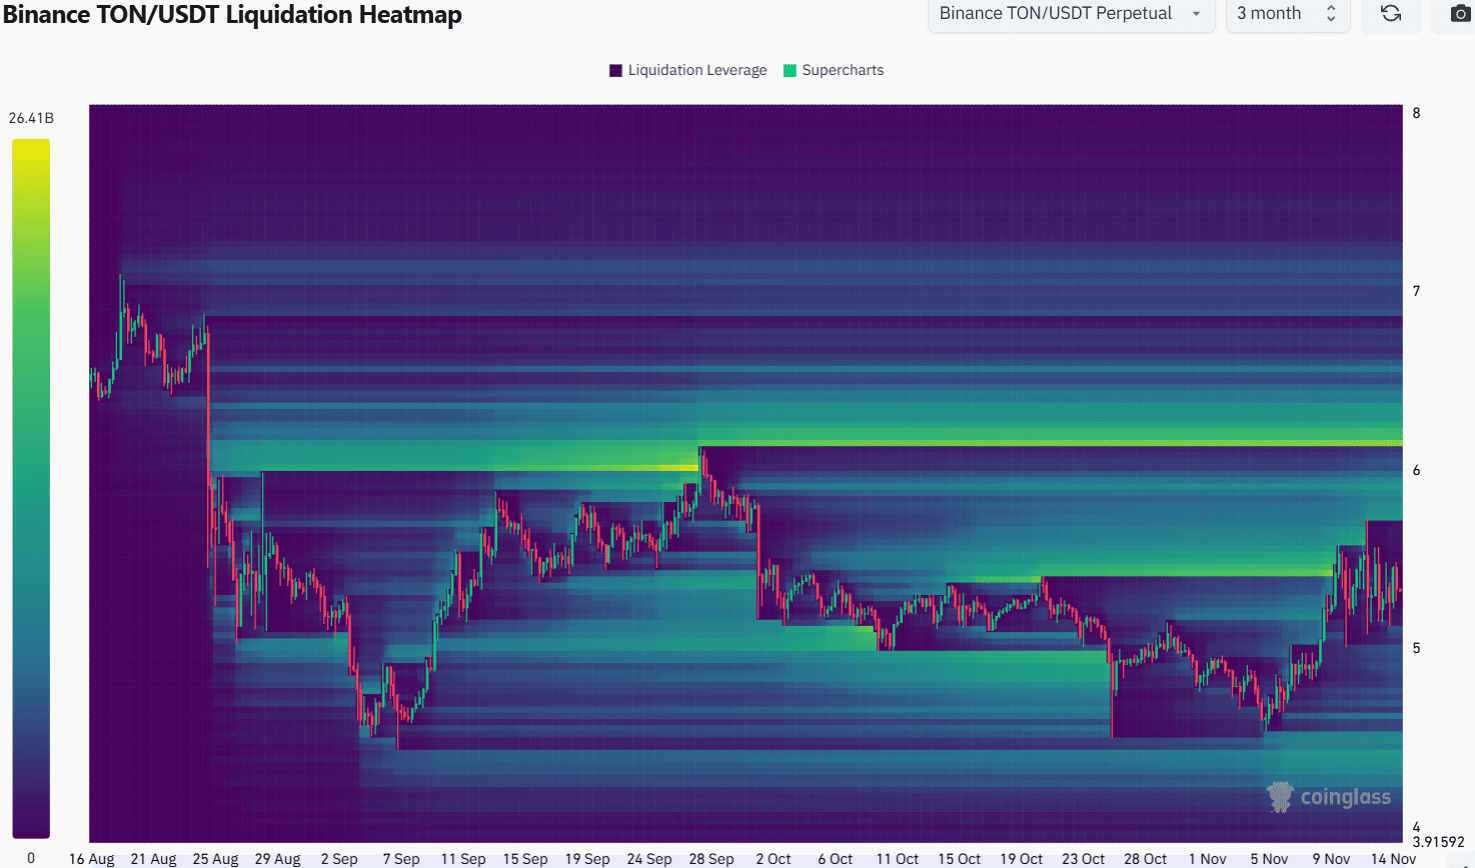
The 3-month lookback period showed that the closest cluster of liquidation levels to TON was above the $6 mark. Specifically, the $5.7-$5.9 region and the $6.2 area were two key resistances overhead.
A sweep of these liquidity pockets can result in a bearish reaction unless TON witnesses a large increase in demand. To the south, the $4.47 level had a smaller cluster of liquidation levels.
Disclaimer: The information presented does not constitute financial, investment, trading, or other types of advice and is solely the writer’s opinion


