Tracing XRP’s extended growth potential after its most recent rally

Disclaimer: The findings of the following analysis are the sole opinions of the writer and should not be considered investment advice.
XRP’s previous patterned breakdown entailed a bearish engulfing candlestick, one that set the stage for retesting the $0.32-support over the last few weeks.
Nonetheless, a recovery above the EMA ribbons has highlighted a robust bullish comeback over the last two days.
The sellers are now attempting to put the brakes on in the $0.36-$0.39 range supply zone. However, a reversal from the three-week trendline resistance (white, dashed) would aid sellers in spurring the selling vigor to induce a sluggish phase.
At press time, XRP was trading at $0.3776, up by over 7.12% over the last 24 hours.
XRP Daily Chart
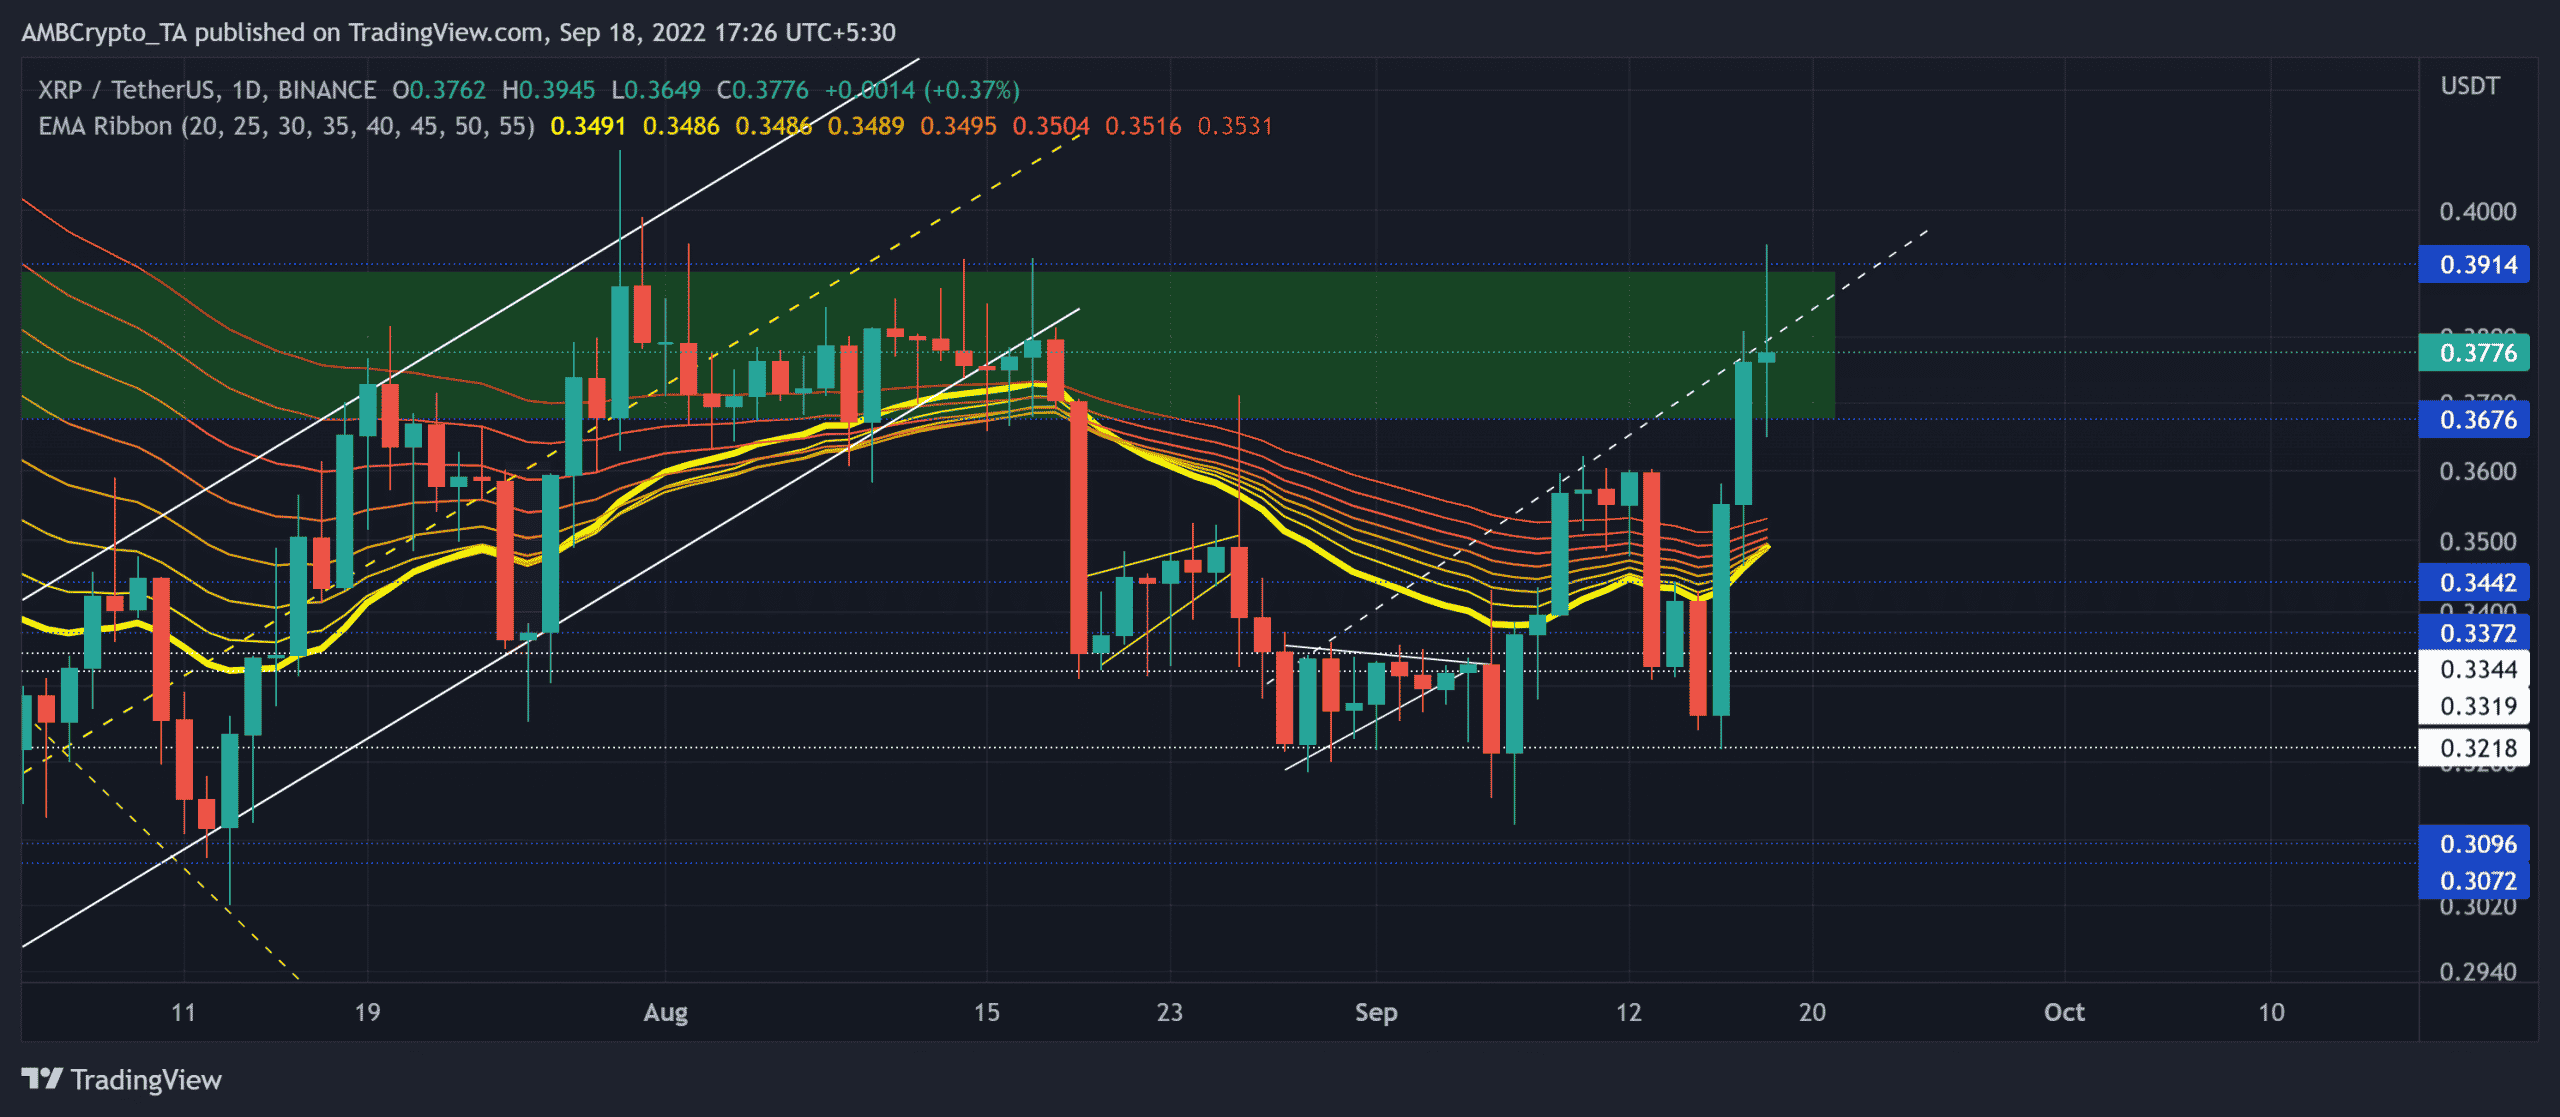
The $0.36-$0.39 range has induced selling rallies over the last three months as the sellers revealed strong inclinations to reject higher prices from this range.
An expected up-channel breakdown kept XRP below the EMA ribbons for nearly three weeks before the bulls stepped in to turn tides in their favor. The $0.32-support rebound pulled off a near 20% return in just two days.
The buyers should look for a potential bullish flip on the EMA ribbons (i.e. the 20 EMA crossing above the 55 EMA) to gauge the alt’s potential to invalidate the bearish efforts in the supply zone.
The bears could aim to evoke a reversal from the three-week trendline resistance or the $0.39-ceiling. A potential reversal from either could induce a near-term decline before a bullish rebound. In this case, the potential targets would lie in the $0.36-$0.34 range.
An eventual close above the $0.39-mark would put the alt in a price discovery with conceivable targets in the $0.41-$0.44 range.
Rationale
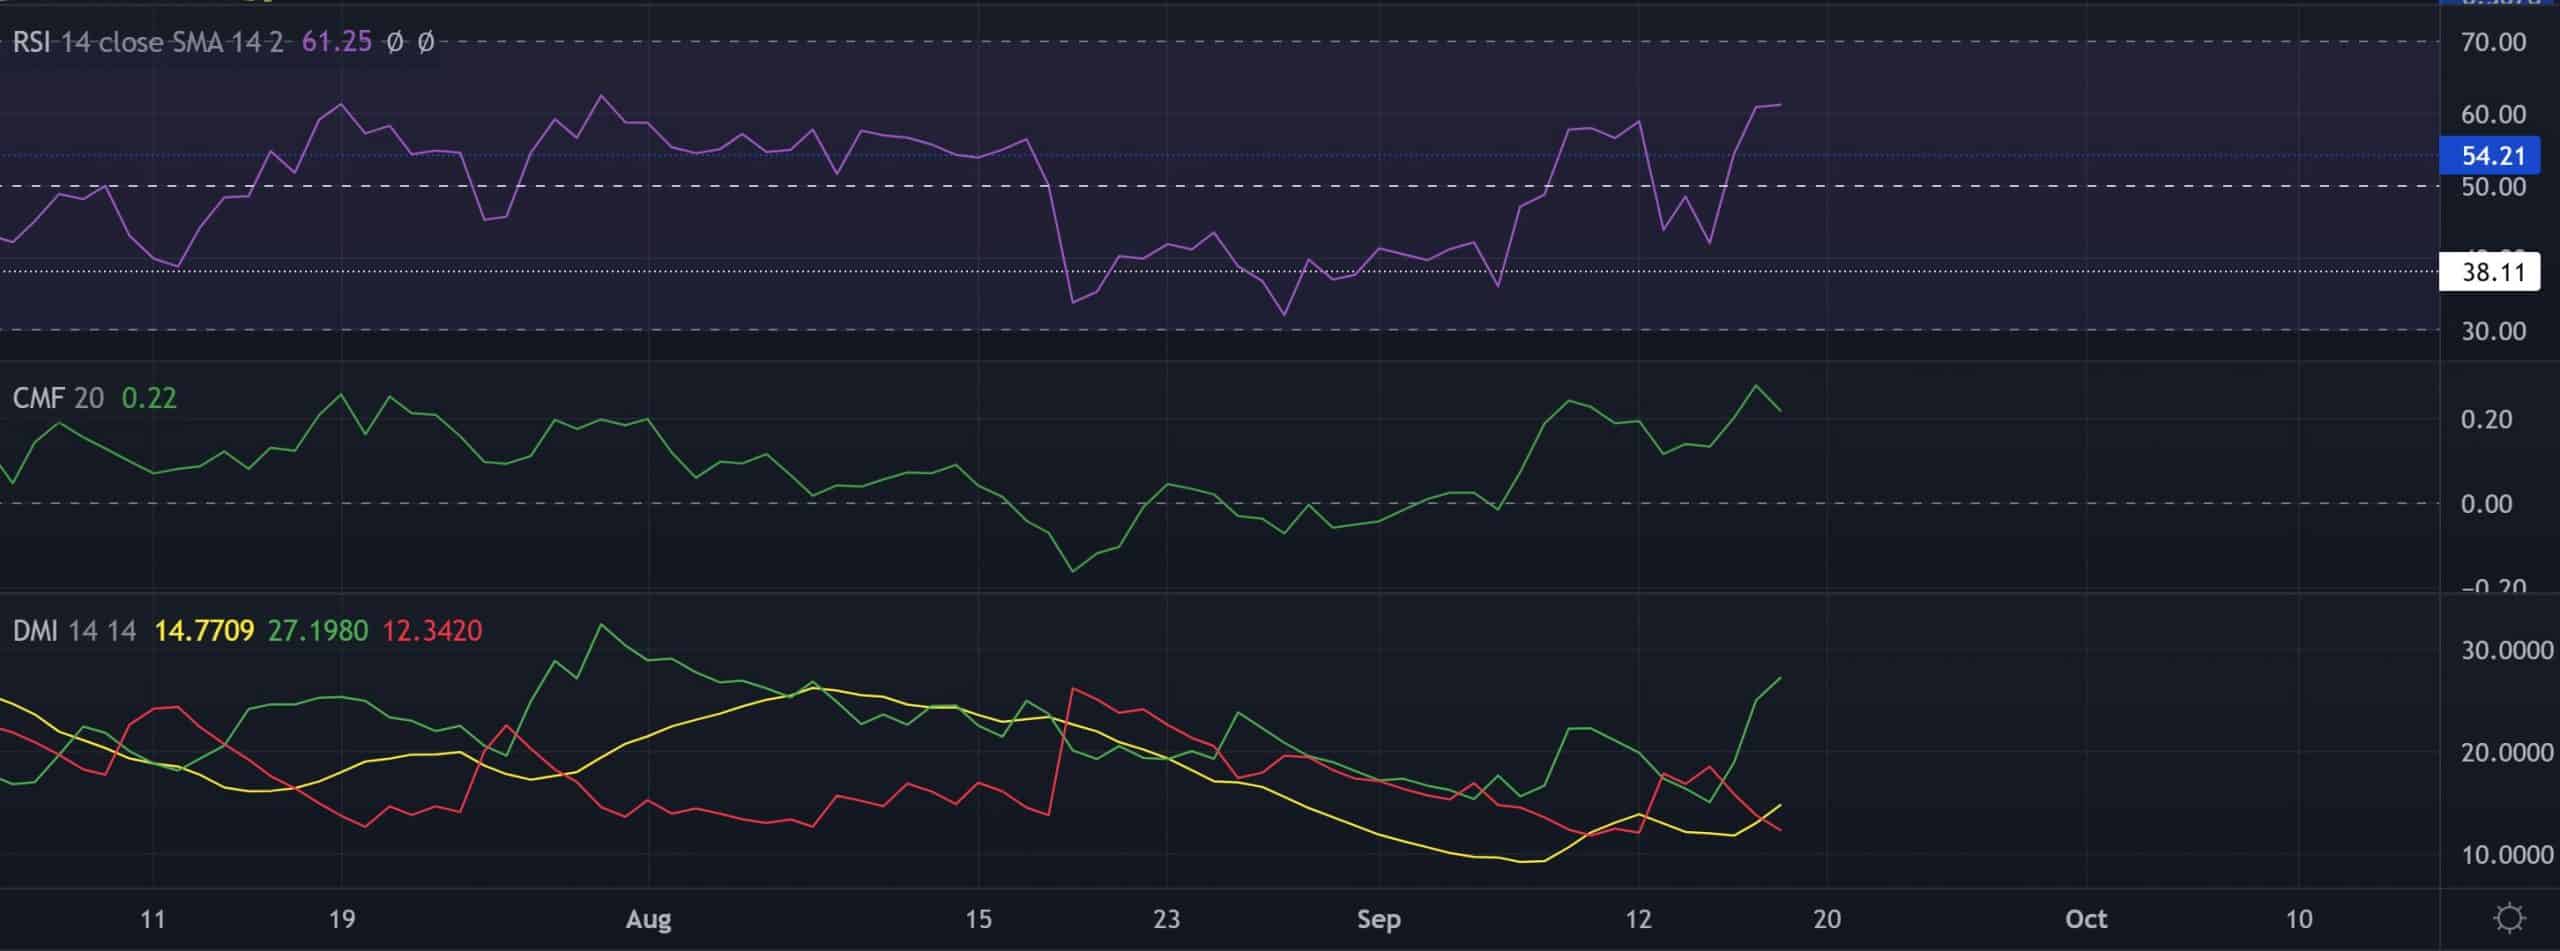
The Relative Strength Index (RSI) finally found a reliable close above the 54-level support to project an increased buying edge.
Also, the Chaikin Money Flow (CMF) swayed near its overbought region to resonate with RSI’s bullish position. The buyers should look for reversal tendencies from these heights to assess the possibility of a price pullback.
Furthermore, the DMI lines revealed a one-sided bullish position. However, the ADX projected a considerably weak directional trend.
Conclusion
In view of XRP’s jump above the EMA ribbons into its supply zone, it is in a rather tricky territory. A potential bullish flip on the ribbons would affirm the press time bullish bias. In either case, the targets would remain the same as discussed.
Finally, keeping an eye on Bitcoin’s movement and the broader sentiment would be important to determine the chances of bullish invalidation.