Traders should expect this as Solana drops below its March low

Disclaimer: The information presented does not constitute financial, investment, trading, or other types of advice and is solely the writer’s opinion
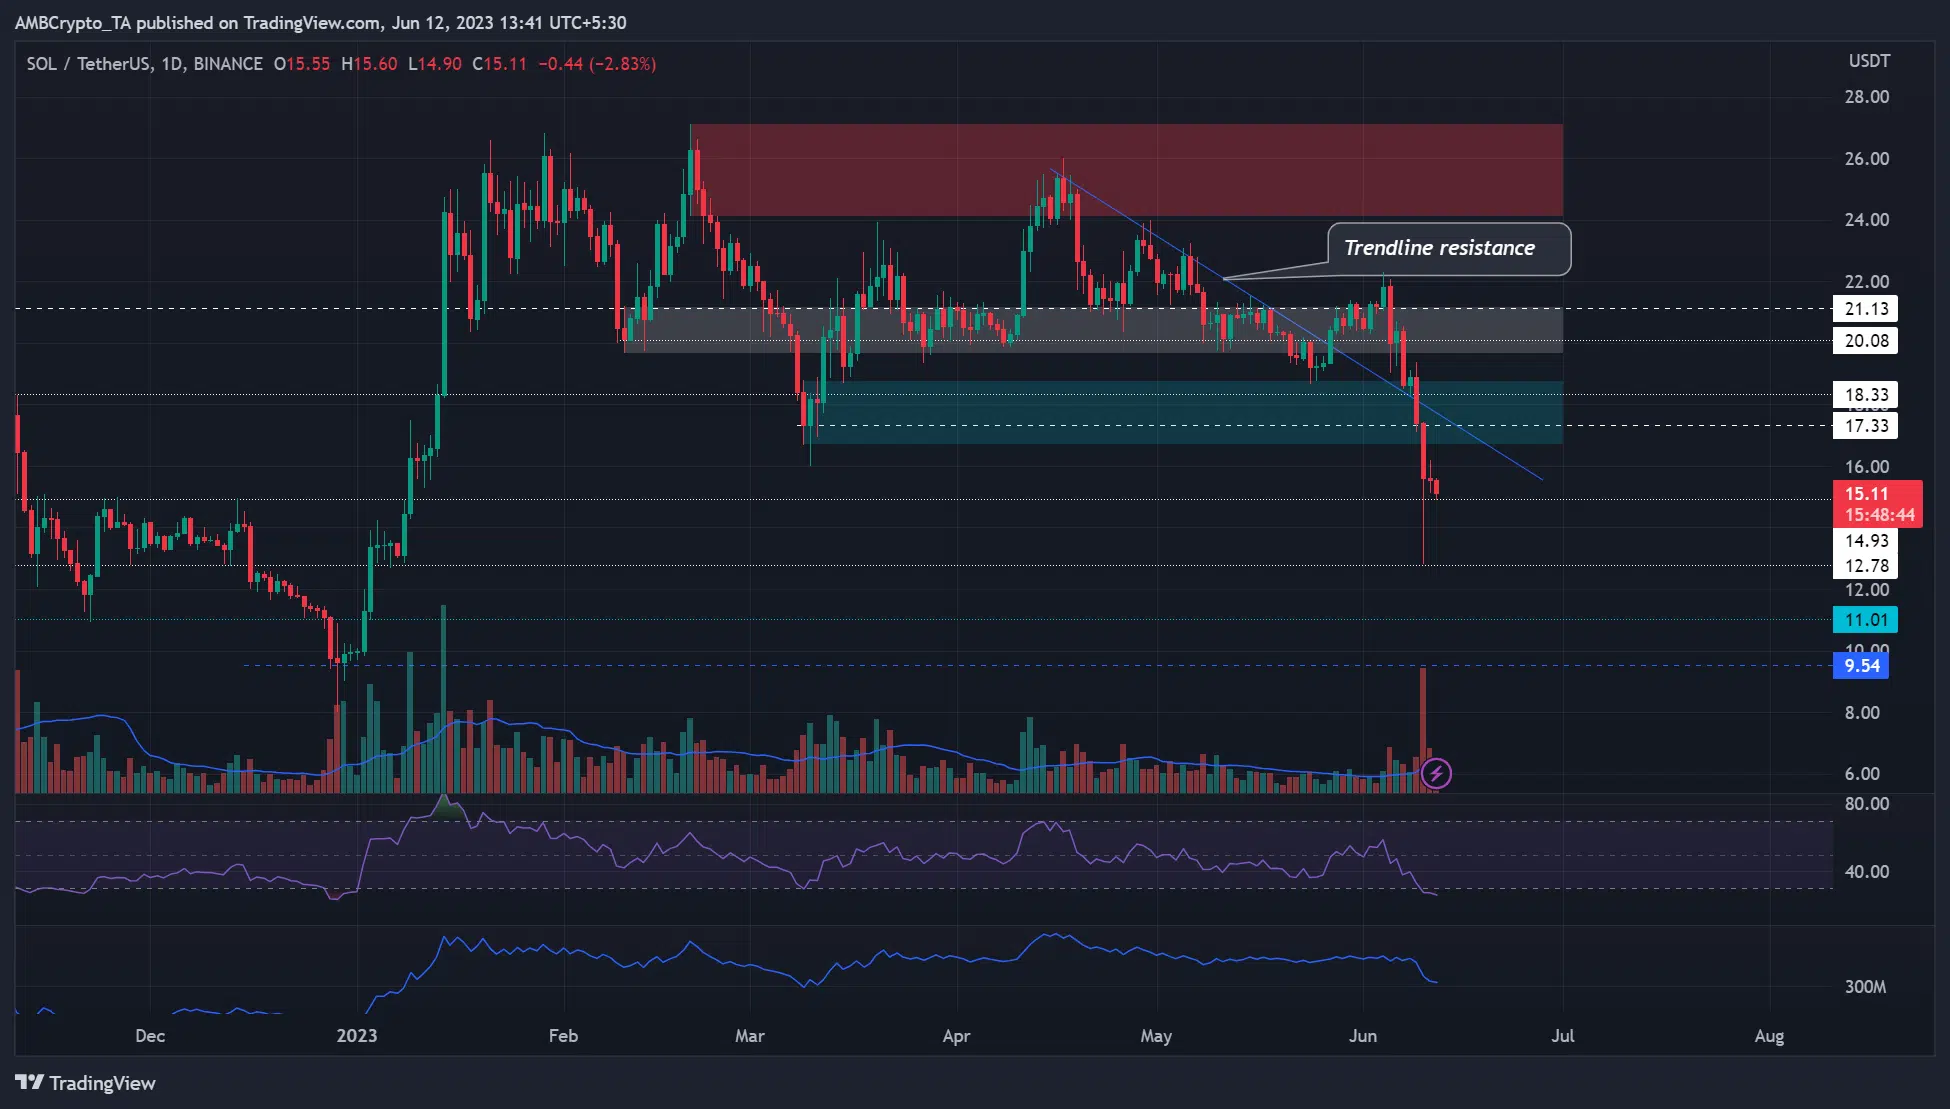
- SOL cracked key support zone of $16.7 – $18.8 (cyan)
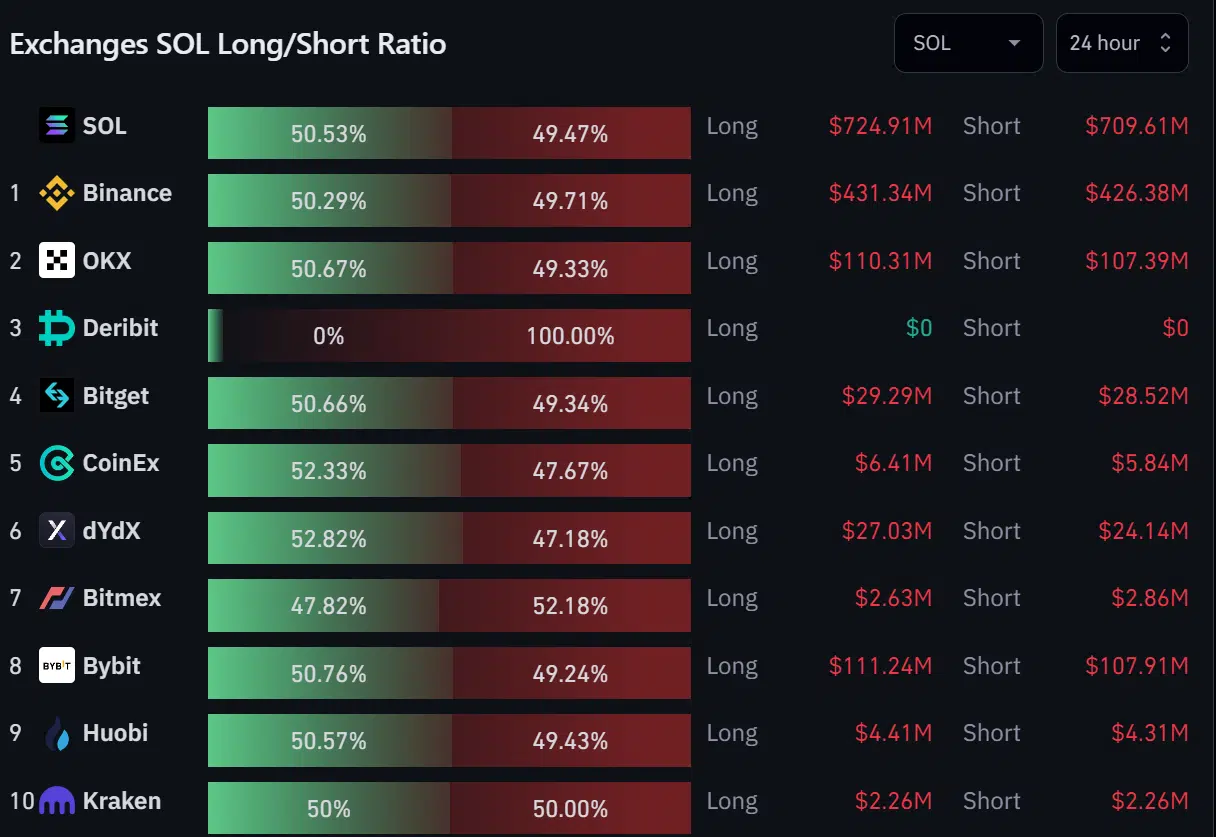
- Sentiment was neutral in the Futures market
After being marked as a “security” last Monday (5 June) by the U.S SEC, Solana [SOL] hasn’t seen any major upside move on the charts. The response by Solana Foundation hasn’t spurred any hopes for bulls as Bitcoin [BTC] hit $25k over the weekend (10/11 June).
Read Solana’s [SOL] Price Prediction 2023-24
At the time of writing, BTC struggled to cross $26k ahead of May’s CPI (Consumer Price Index) data scheduled for 13 June and the FOMC meeting on 13/14 June. A higher timeframe bullish bias for BTC, above $27k, could tip SOL to clear a key overhead roadblock.
SOL flips bearish after weekend dump
The weekend’s slump saw SOL breach the support zone of $16.7 – $18.8 (cyan). The support zone was also a bullish order block (OB) formed on 9 March on the daily chart. The weekend slump followed BTC’s retest of $25k, flipping SOL to a bearish bias after dropping below the trendline resistance and March’s low of $16.
Unless BTC moves beyond $26.6k and crosses above $27k, bulls could have difficulty clearing the confluence area of bullish OB and trendline resistance near $17. A price rejection at the aforementioned confluence area could drag SOL to $14.9 or $12.8 support levels.
Conversely, bulls could gain an edge if SOL close above the confluence area of $18.75. However, they must clear the overhead roadblock of $19.7 – $21.2 (white) – Another bullish OB-turned-resistance zone formed on 10 February on the daily chart.
The RSI slid into the oversold zone, at the time of writing, while the OBV dropped to 300 million, denoting a dip in buying pressure and demand.
The calm before the storm?
The 24-hour timeframe for SOL’s exchange longs/shorts ratio showed a neutral sentiment in the Futures market. Similarly, the overall crypto-sentiment, as of press time, was “neutral,” as per the Crypto Green and Fear Index.
Is your portfolio green? Check out the SOL Profit Calculator
However, this could be the calm before the storm as price swings can be projected from 13 June. Traders should track this week’s (11-17 June) U.S economic calendar for more optimized trade set-ups.


