Tron, Aave, Zcash Price Analysis: 14 December

Tron bounced off an important Fibonacci retracement level at $0.0277, but it should be noted that it has been on a downtrend throughout December. It remains to be seen if market sentiment has shifted, or whether the bears will step in with force again as TRX nears the important level of resistance at $0.03. Further, Aave appeared to be headed further south, while Zcash was heading lower to a region of support.
Tron [TRX]
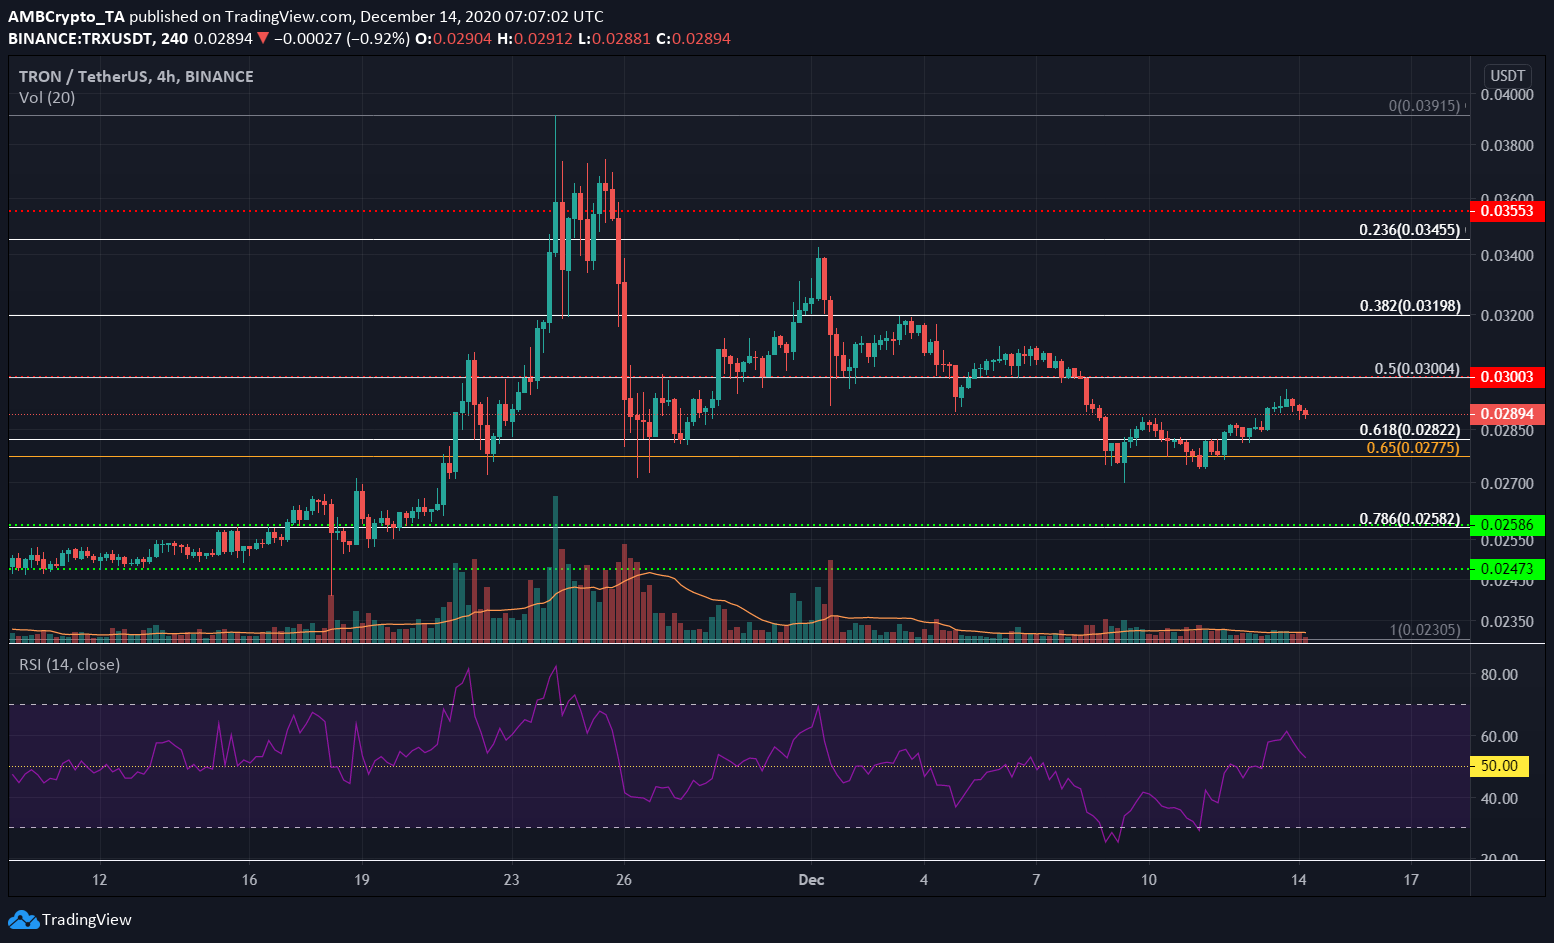
Using the move from $0.023 to $0.039, the Fibonacci Retracement levels were drawn. The golden pocket which represents the region between the 61.8% and the 65% retracement levels acted as a region of demand for TRX over the past week.
The RSI rose past the neutral 50-line as TRX bounced off the $0.0282-level. Further ascent by TRX would indicate that a short-term uptrend has been established.
The 50% retracement level had confluence with the horizontal level of support at $0.03, making it an important level of resistance. The region at $0.0277 and $0.0282 was an important support zone too..
Aave [AAVE]
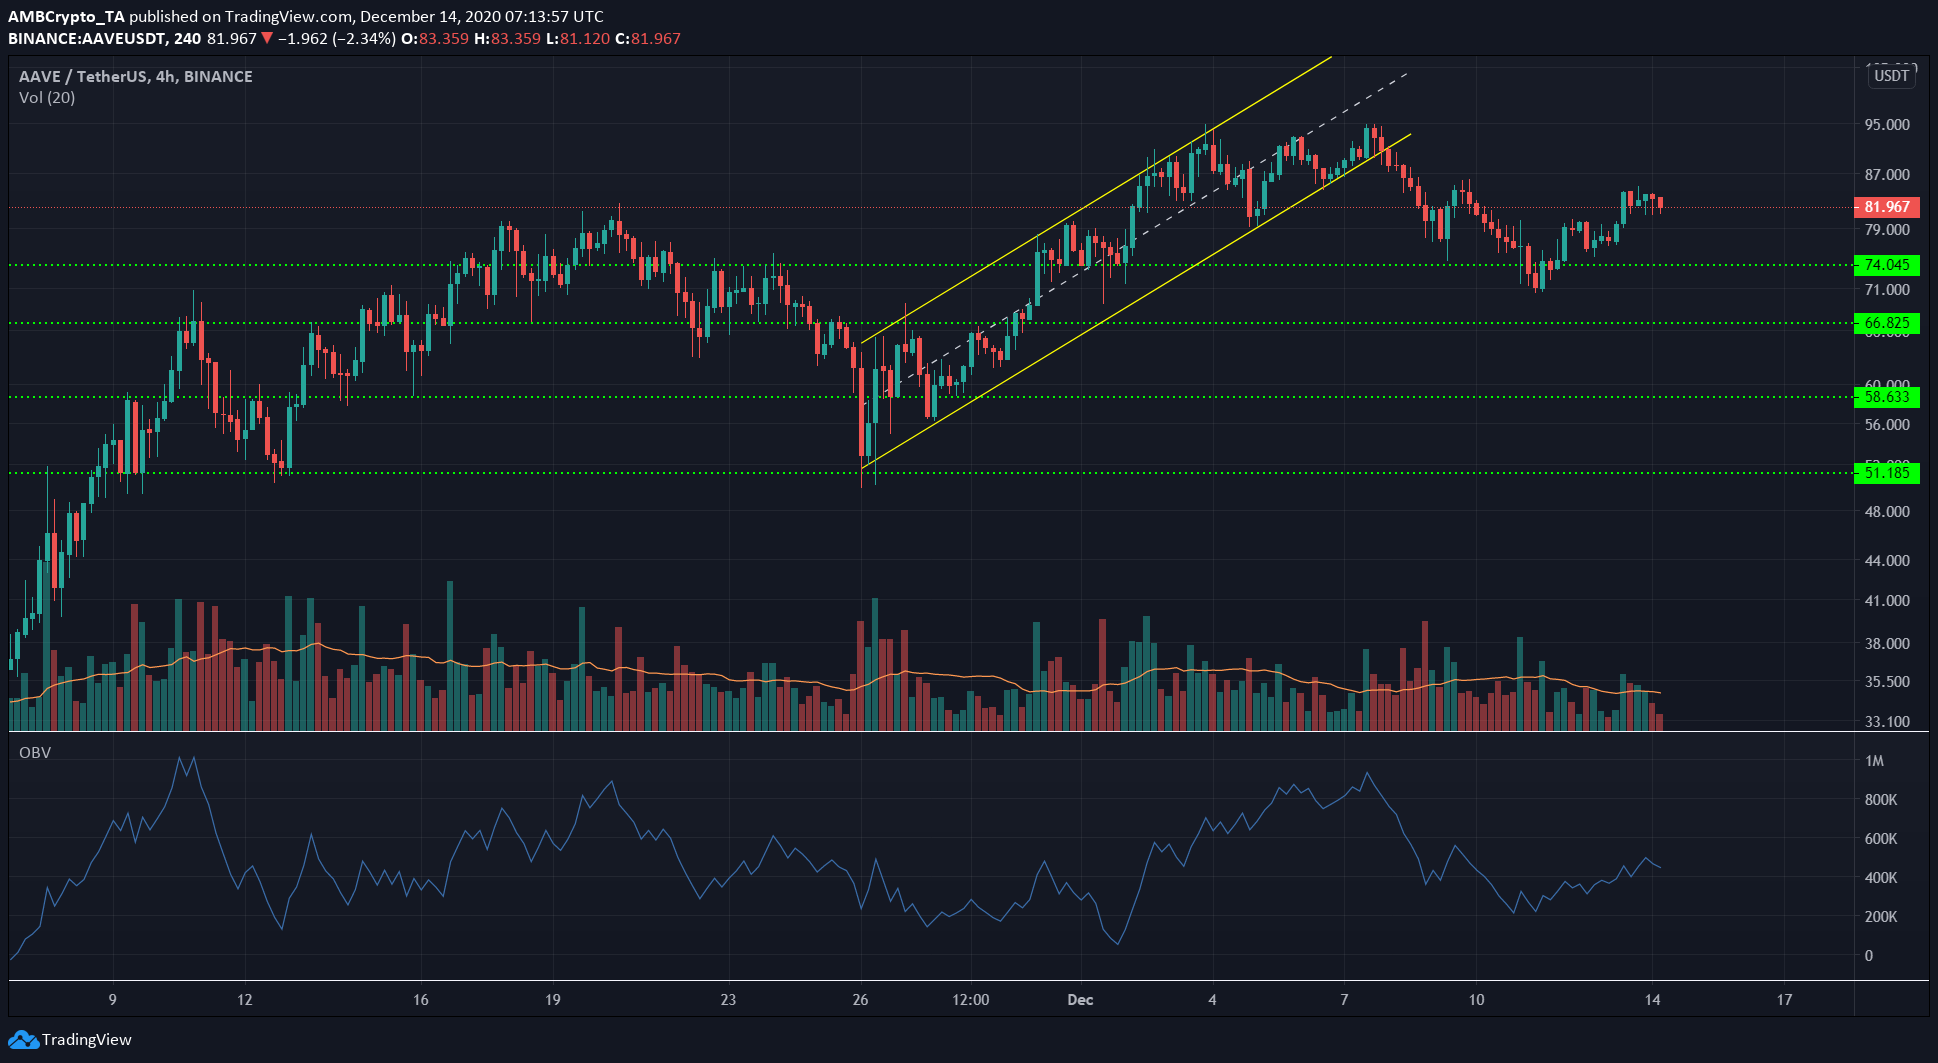
Aave closed under an ascending pattern last week and was expected to descend further to reach the base of the channel at $58. This was the general price target for a breakout of the channel.
Aave bounced off the $74-level a few days ago. However, the OBV showed that no strong buying volume followed AAVE to $82.
The bounce appeared to have ended at $84, and mounting selling pressure could force AAVE back to the $74-level and perhaps, further below in the coming days.
Zcash [ZEC]
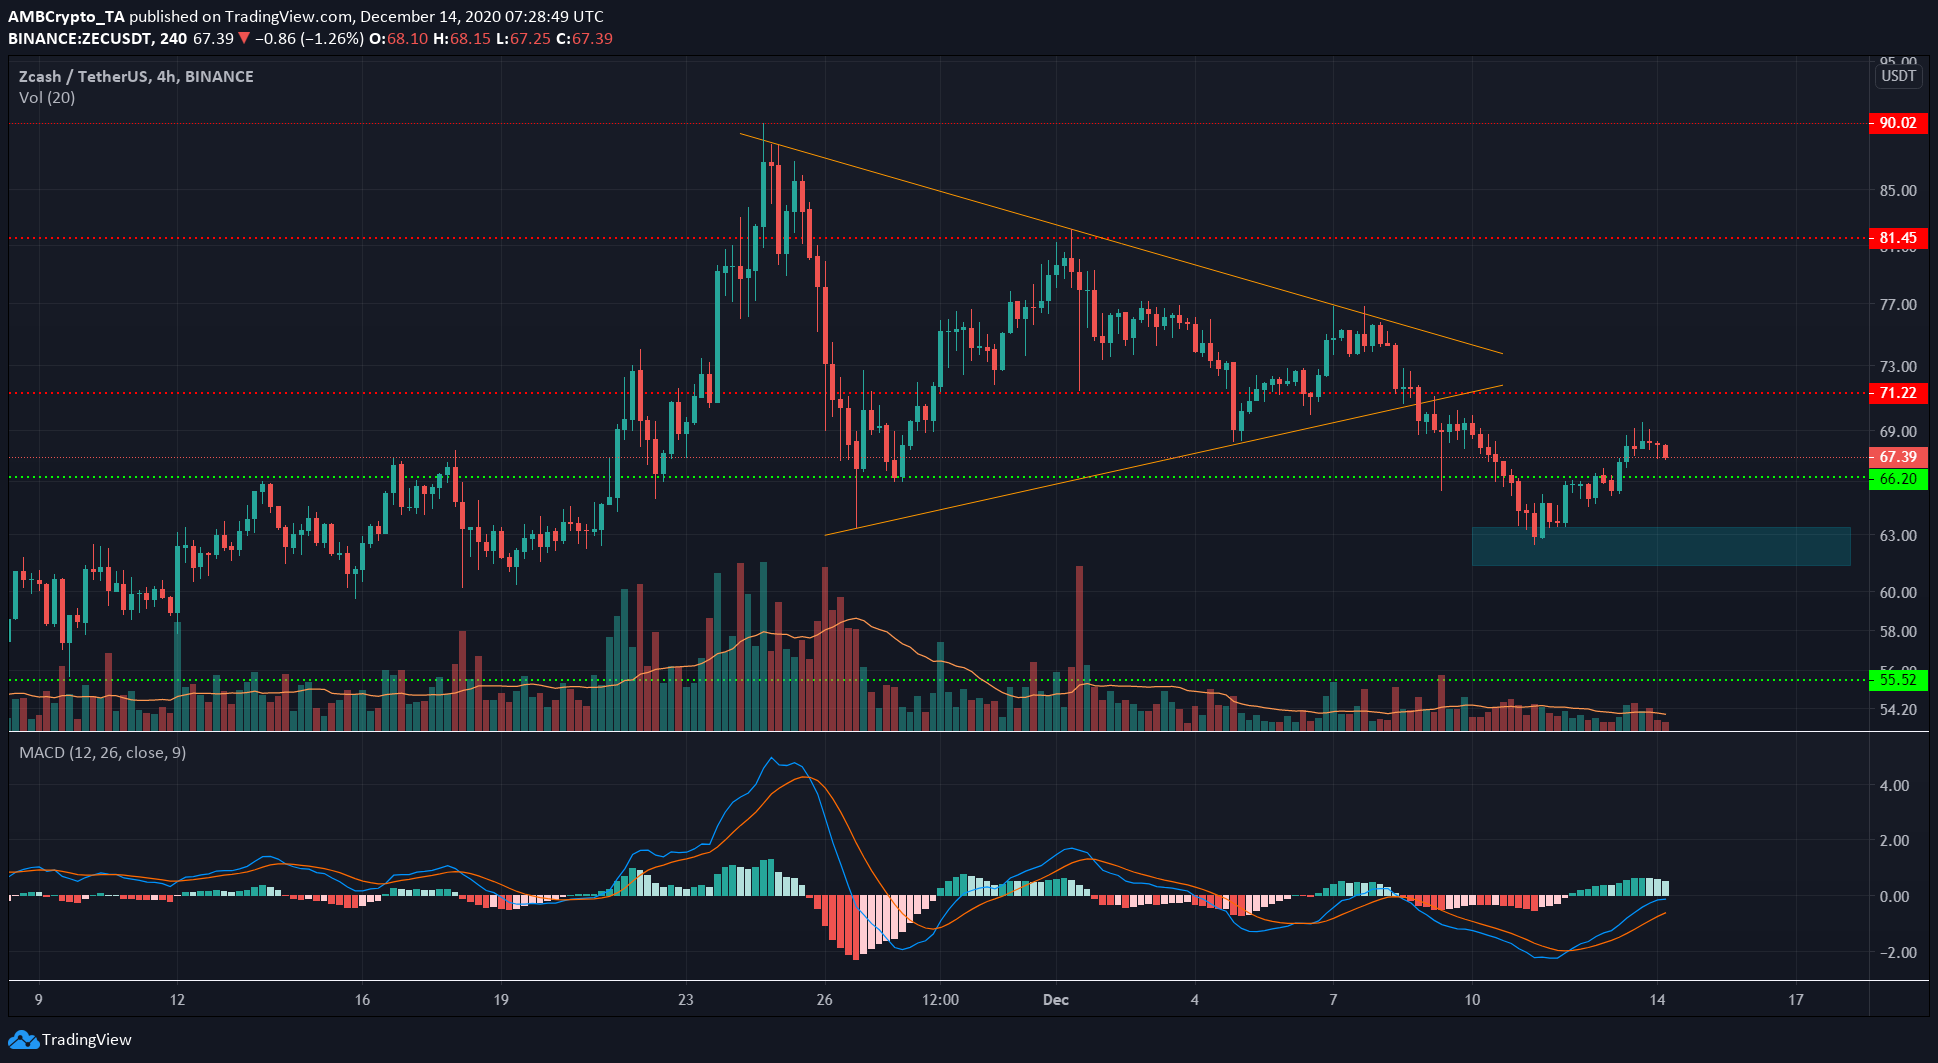
ZEC formed a symmetrical triangle and saw a breakout to the downside. However, the pocket of liquidity in the vicinity of $62 saw the price bounce higher, before it met some selling pressure at $69.
Finally, the MACD formed a bullish crossover but it was still beneath zero, and hence, it was a weak buy signal at best. It seemed more likely that ZEC would continue the downtrend from late November and lose the $66-support and drop to the liquidity pocket highlighted.