Tron: Assessing the implications of these caveats to TRX’s recent bull run

Post an impressive bullish streak for a few months, the 61.8% Fibonacci resistance reignited the alt’s bearish tendencies. The decline from the $0.08-level helped the sellers to recoup and find a close below the EMA ribbons.
The next few candlesticks would likely affirm or invalidate the bearish inclinations. An extended bull rally could help the buyers to retest the 38.2% level before a likely reversal. At press time, TRX was trading at $0.07087.
TRX Daily Chart
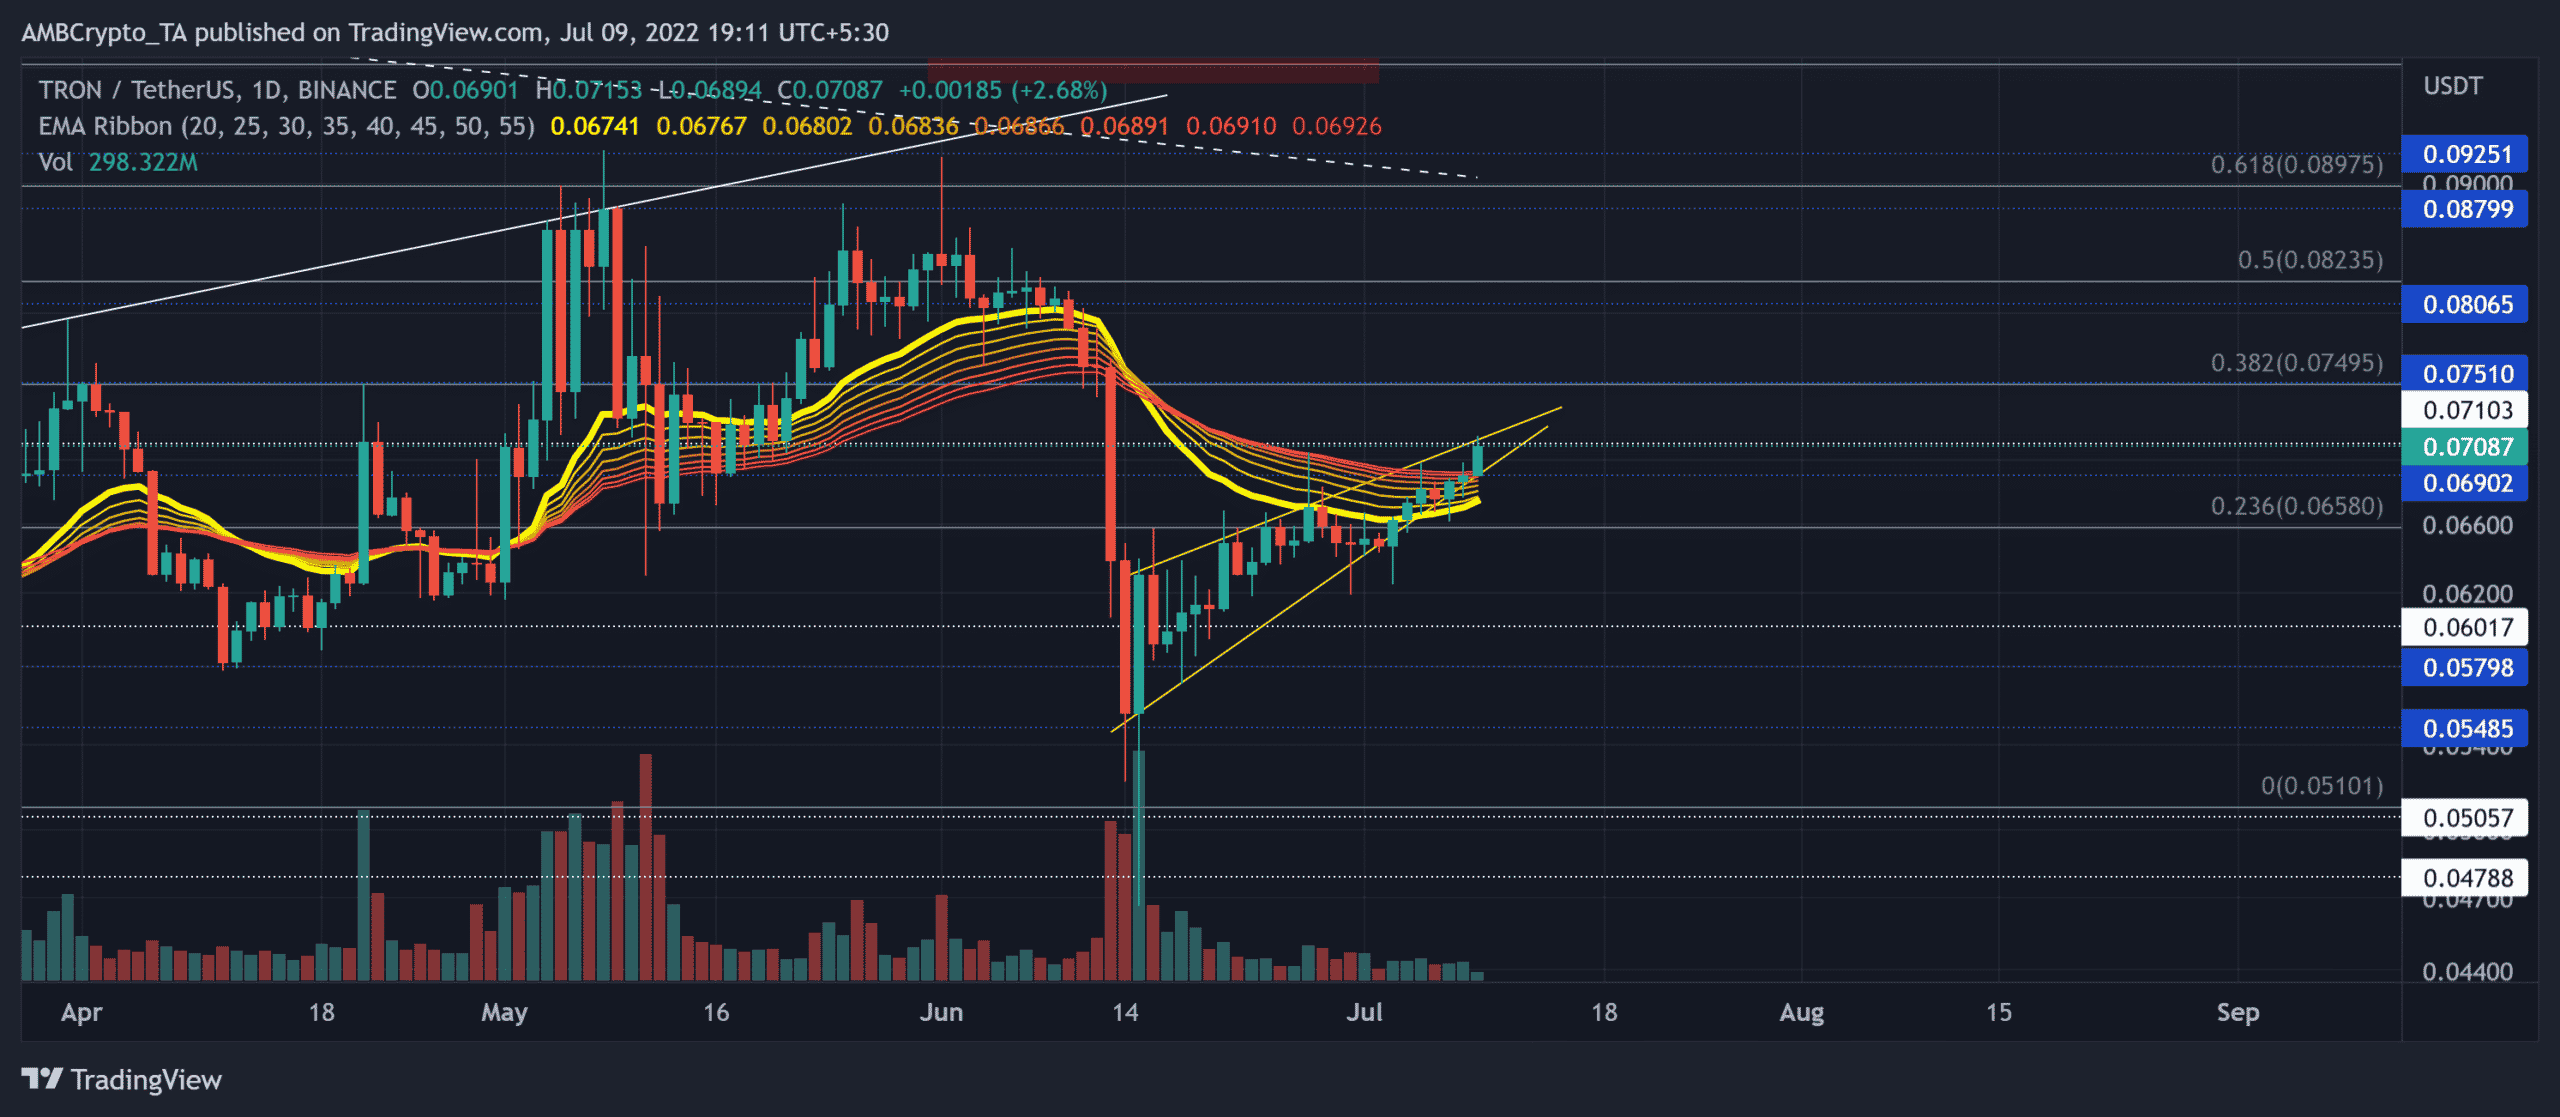
TRX has seen a steep revival after dropping towards its yearly low on 15 June. The recovery from its long-term support entailed a bearish rising wedge setup on the daily chart.
With the EMA ribbons looking north, the buyers aimed to propel a bullish flip on the ribbons. As a result, the price action saw a jumped above the $0.06 zone.
Any patterned breakdowns would pave a path for a short-term retracement. In this case, the potential targets rest in the $0.057-$0.06 range.
A continued bullish momentum could be short-lived by the $0.074-mark resistance. Investors should look for rebounding signals from this region. In the case of a bounce-back, the alt could see a pullback toward the $0.065-zone. Investors/traders must take note of the broader macro-economic sentiments affecting placing long bets.
Rationale
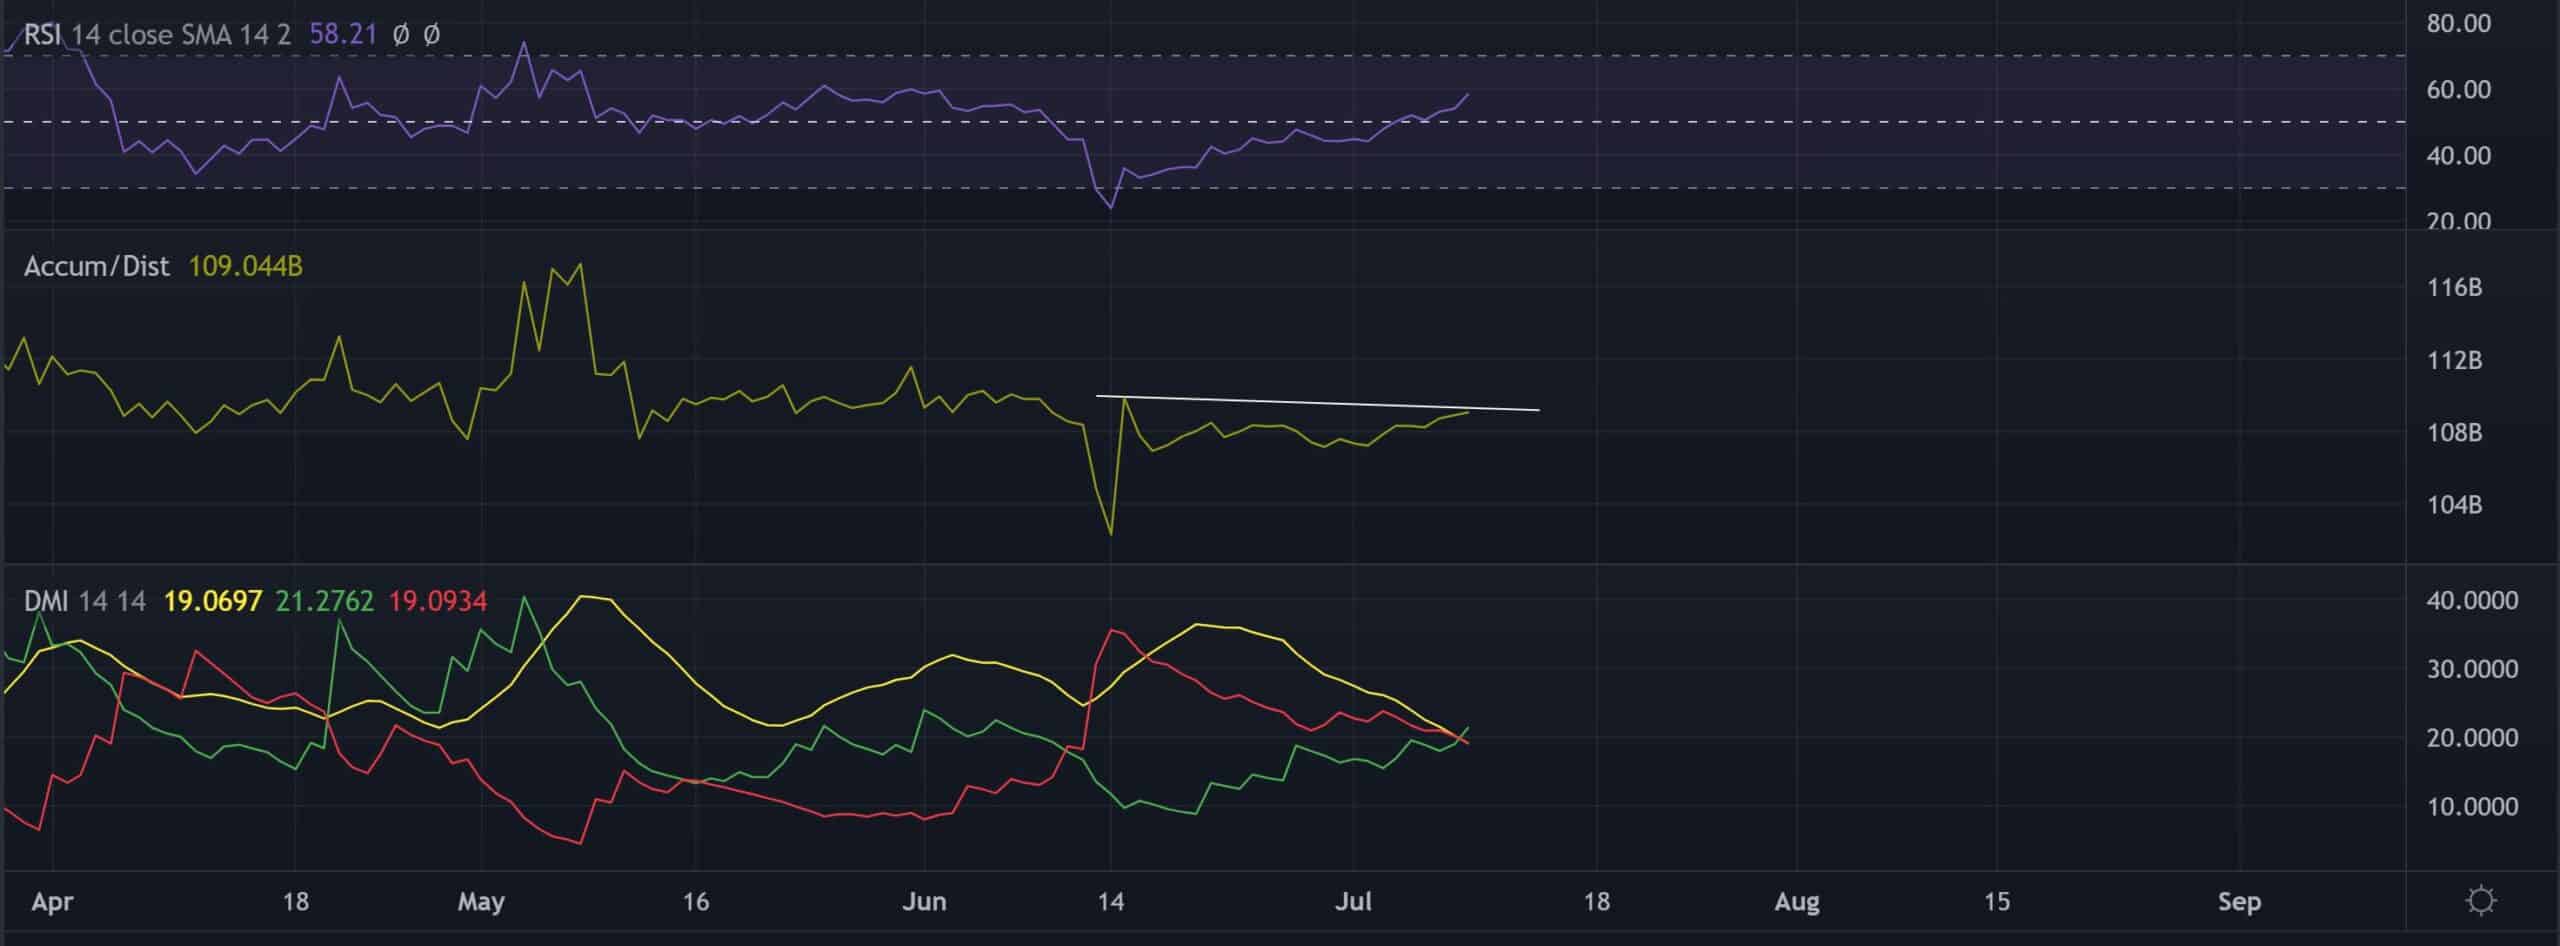
The Relative Strength Index (RSI) finally saw a close above the midline. A sustained position above would help the buyers to hold the immediate support level on the chart.
On the flip side, any reversals on the Accumulation/Distribution (A/D) indicator would affirm a bearish divergence with the price. Furthermore, the Directional Movement Index (DMI) resonated with the bullish narrative by undertaking a bullish crossover, but the ADX continued to display a weak directional trend.
Conclusion
Given the bearish rising wedge setup alongside the declining volumes, TRX could see a decline before picking itself up. The targets would remain the same as above. Any bearish invalidations could be constricted by the 38.2% level.
Finally, investors/traders should consider Bitcoin’s movement and its impact on broader market perception to make a profitable move.


