
Tron was predicted to remain below $0.18 resistance over the coming days. Bitcoin Cash showed some weakness after closing in on $1,460 resistance. Lastly, Monero could see pullbacks at $381.3 or $340.8 in a bearish outcome.
Tron [TRX]
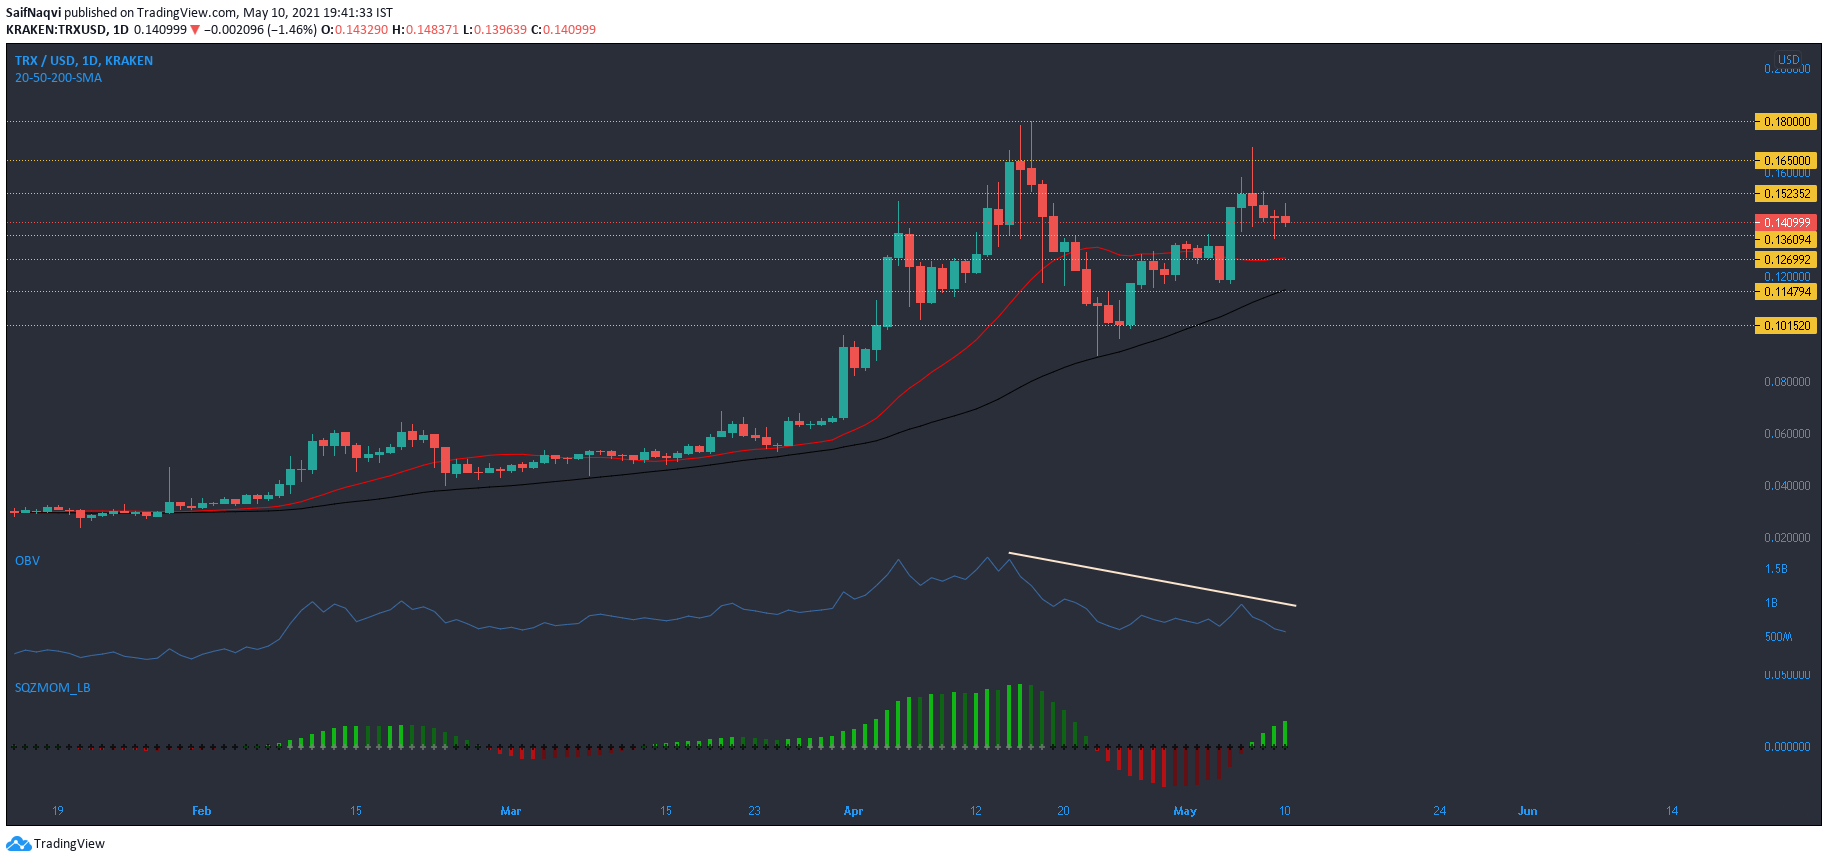
Source: TRX/USD, TradingView
A downtrend in the OBV showed weakening buying pressure and suggested a pullback for Tron before the next upswing. On the daily timeframe, some resistance around $0.15, although a few candlewicks did rise above $0.165.
According to Squeeze Momentum Indicator, momentum still rested with the buyers but low volatility in the market disallowed for large price swings. This indicated that bears would maintain $0.18 resistance over the coming days. In case of a breakdown from the press-time support, additional support levels rested at $0.126 (20-SMA) and $0.11 (50-SMA).
Bitcoin Cash [BCH]
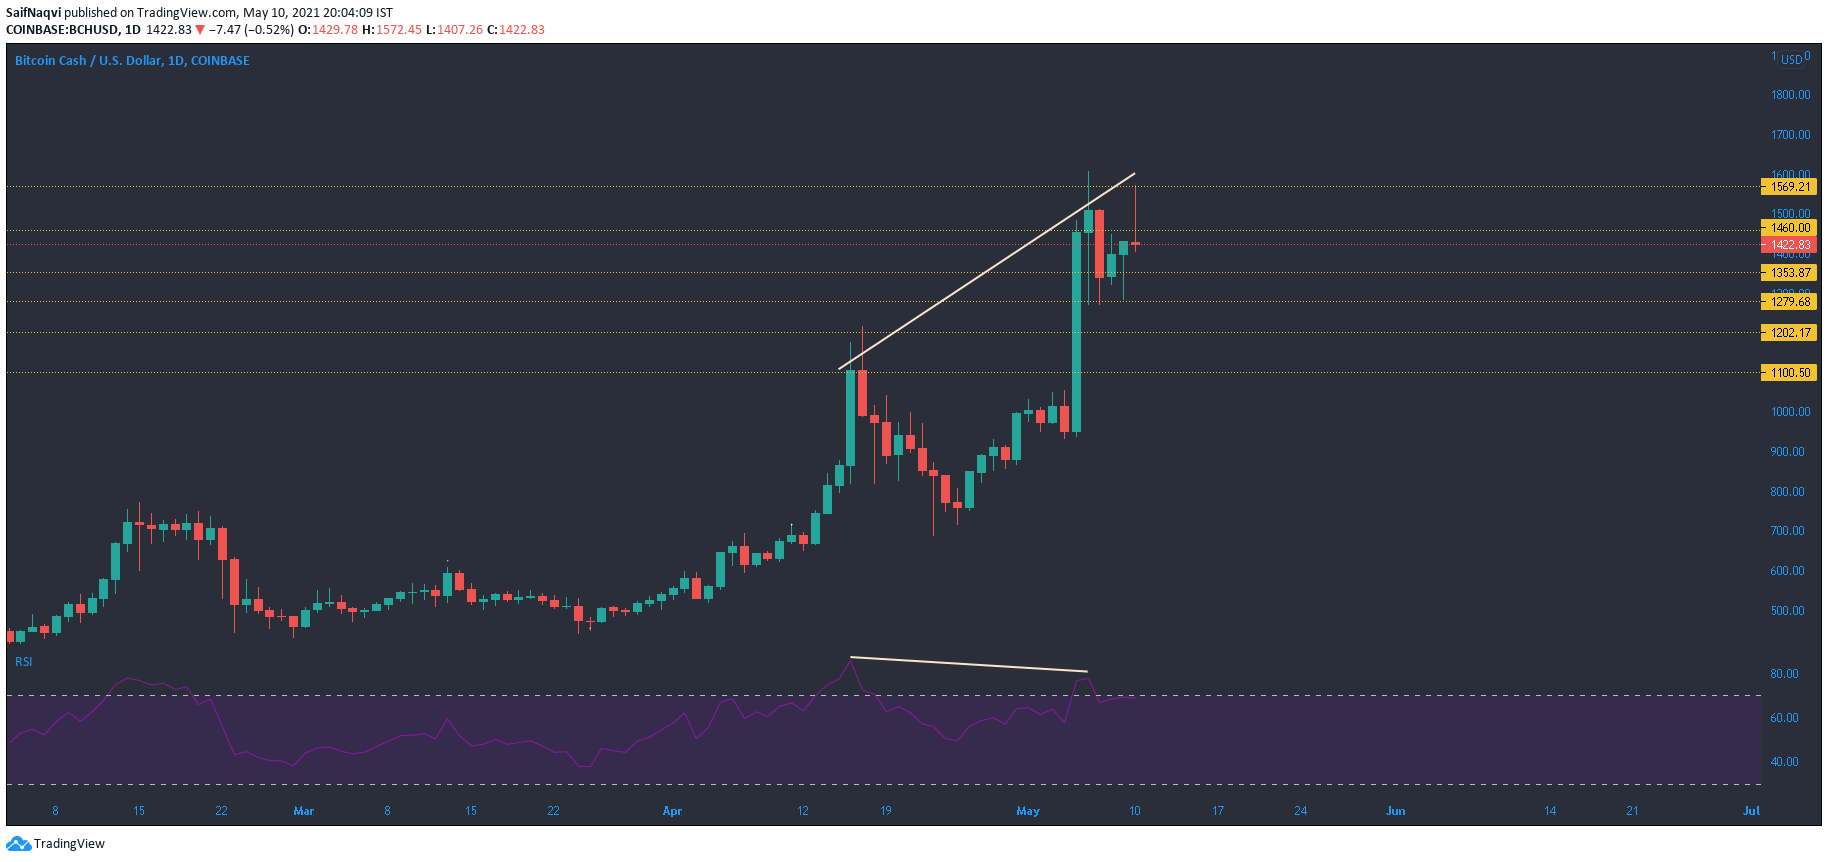
Source: BCH/USD, TradingView
While the daily timeframe noted a couple of green candlesticks as Bitcoin Cash closed in on $1,460 resistance, there was some skepticism in the market. The RSI moved back in the overbought territory and indicated another pullback moving forward. Prominent areas of support lay at $1,280 and $1,100. If BCH breaks below these days, buying could take place at $820- a region that coincided with the 50-SMA.
In case of a favorable outcome, the bulls have to retake $1,570-upper ceiling. Further hikes in the 24-hour trading volumes would signal an incoming price swing. However, a doji candlestick or bearish spinning top would confirm a pullback.
Monero [XMR]

Source: XMR/USD, TradingView
The Fibonacci tool was used to highlight a few levels of support and resistance in the Monero market. These lines were also extended to identify potential target levels in case of a rise above $516. Since April 11, RSI has formed lower highs and showed bearish divergence with regards to the price. This revealed a degree of weakness in the current uptrend, one that could lead to a breakdown on the charts. Fibonacci levels at 61.8% ($381.3) and 50% ($340.8) could hold up in case of a pullback. A sharper pullback below 200 would likely lead to an extended bearish market as this coincided with the 200-SMA (green)
On the other hand, Fibonacci extension levels (not shown) rested at 138.2% ($643.4) and 161.8% ($724.3). The MACD was well above the half-line and suggested an extended rally.