Tron bucks expectations, breaches $0.078 resistance

Disclaimer: The information presented does not constitute financial, investment, trading, or other types of advice and is solely the writer’s opinion.
- Tron was able to breach the bearish breaker block from July.
- The short-term momentum and capital flow favored the buyers.
Tron [TRX] saw a bullish market structure develop over the past two days, even as the prices fluttered within a resistance zone. This was a sign that buyers had the upper hand in the near term.
Is your portfolio green? Check out the TRX Profit Calculator
A recent report highlighted the expectation that TRX would face rejection at this confluence of resistance zones. Instead, the asset managed to beat the resistance and could be set to climb higher even as the rest of the market faced selling pressure.
The break in structure showed that the $0.085 is a likely target
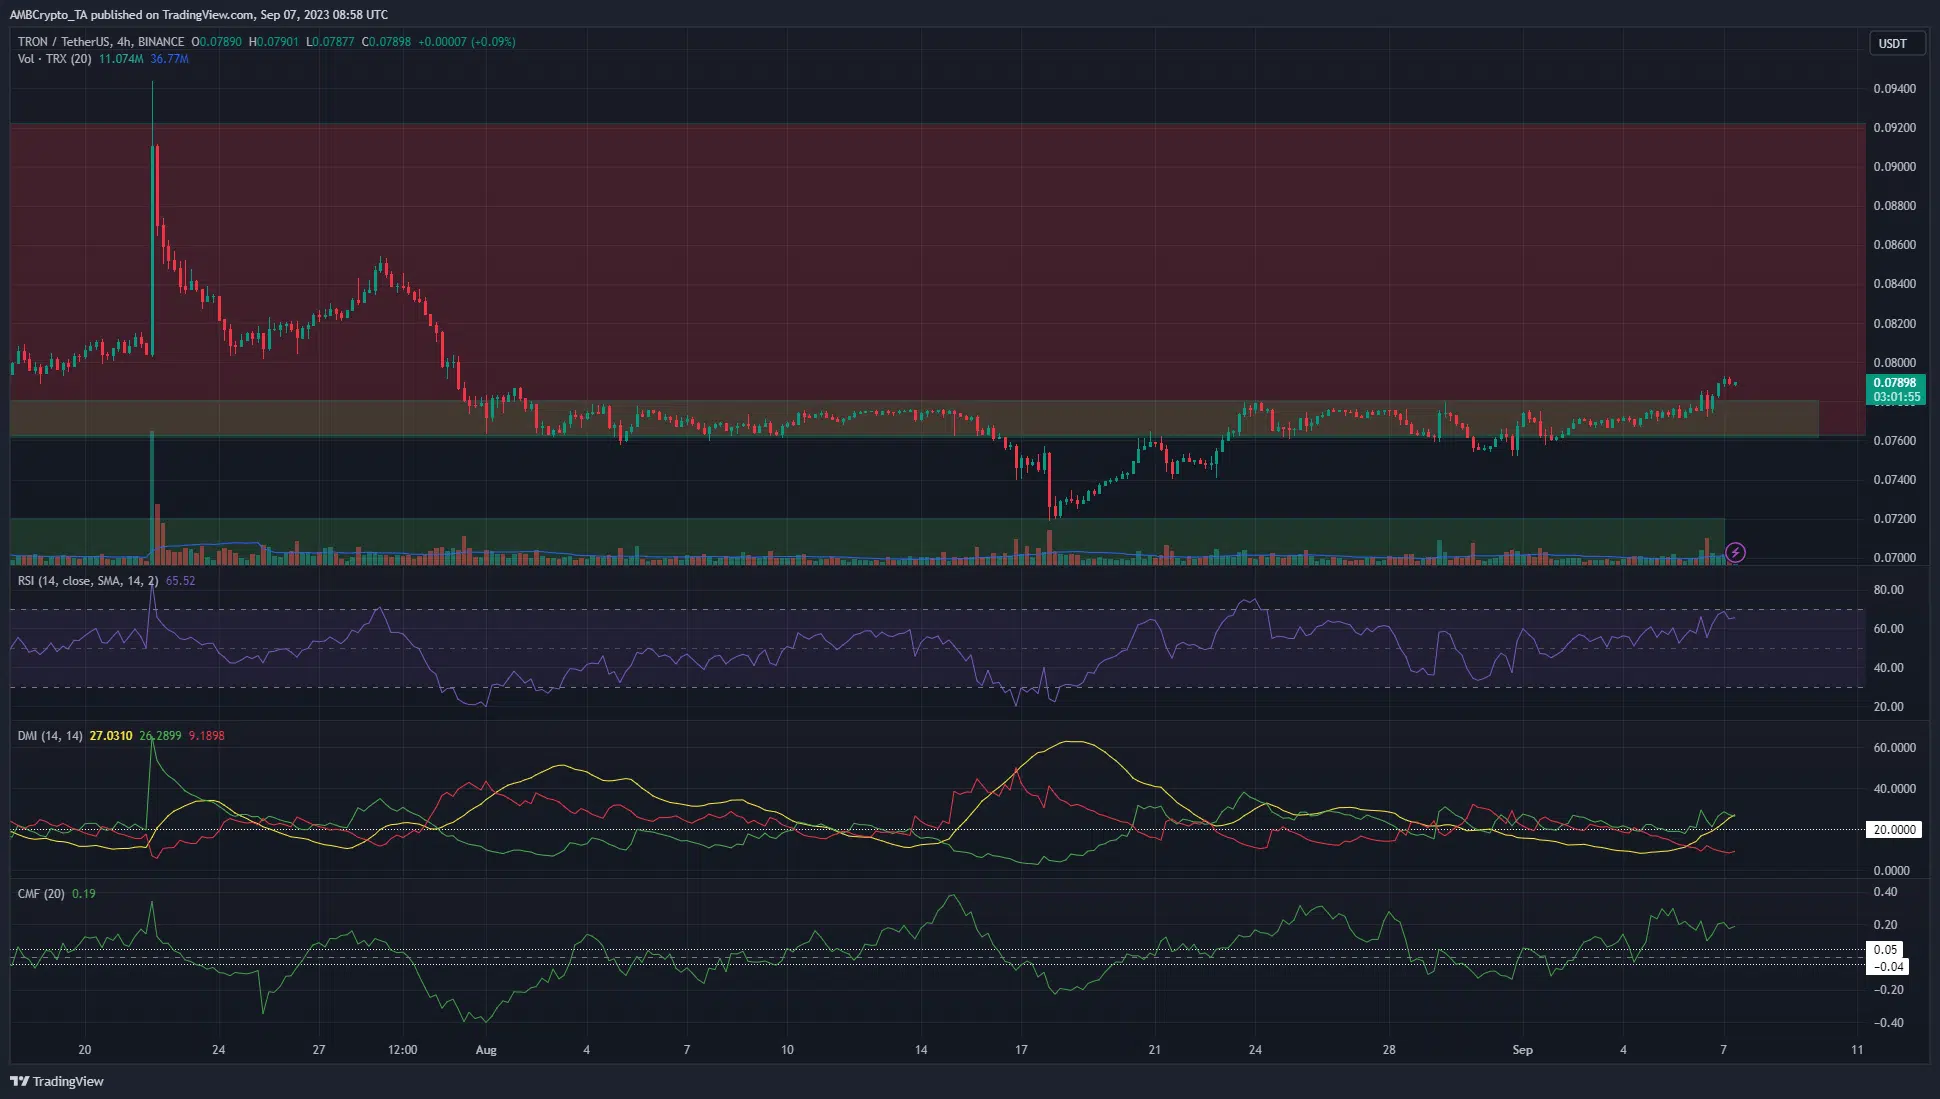
On the 4-hour chart, the market structure had been bearish heading into September. It stayed that way till 5 September, when TRX bulls managed to drive prices above the recent lower high at $0.0775.
Following this, TRX slowly climbed higher and was trading above the bearish breaker block from the daily timeframe (upper green box).
The red zone from $0.076-$0.09 represented a resistance from the weekly timeframe. Yet, within this zone, there is plenty of room for TRX to register gains. The local high at $0.08545 from late July was an area of interest.
A move into this region would likely encounter significant selling pressure. The $0.085-$0.09 zone has served as resistance since June 2022, and the buyers will not have an easy time breaking through.
The RSI showed bullish momentum on the H4 chart, and the DMI indicated a strong uptrend in progress. The CMF was also encouraging and signaled sizeable capital inflow with a reading of +0.19.
Bullish confidence in Tron was reflected in the spot market

Source: Coinalyze
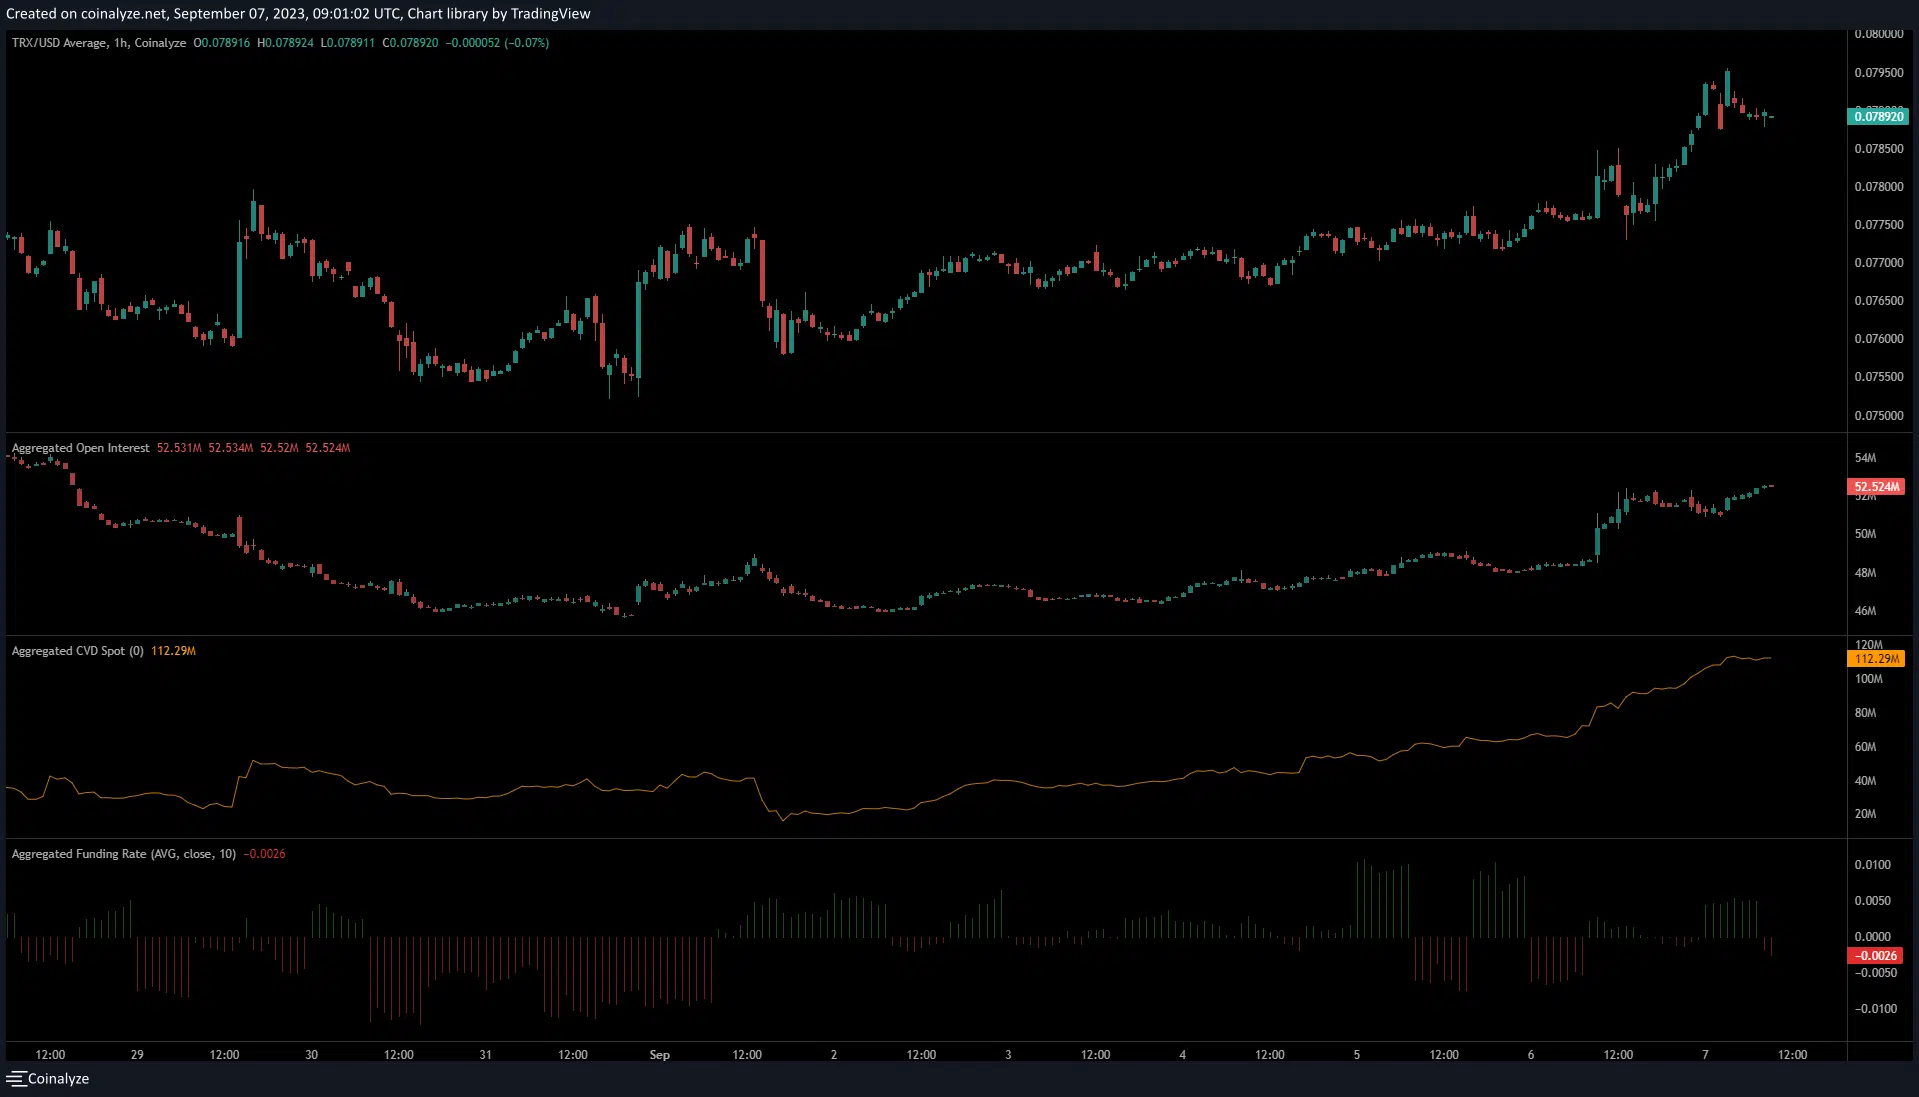
As Tron climbed higher, the Open Interest also jumped from $48 million to $52 million over the past two days. This was a sign of bullish conviction from speculators. The spot CVD was in an uptrend as well.
How much are 1,10,100 TRXs worth today?
Together, they showed demand for the token and reflected a belief in the market that further gains would arrive. Yet, the funding rate, which had been positive, flipped negative at the time of writing.
Are the short positions ahead of the curve, or will they be forced to yield upon a TRX bounce, and drive the bounce further northward? It remains to be seen.


