Tron: Chalking out the odds of TRX unleashing its volatility

Disclaimer: The findings of the following analysis are the sole opinions of the writer and should not be considered investment advice
While extending its compression in the $0.063-$0.0702 range for nearly seven weeks, Tron [TRX] has been in a low volatility phase. Unlike most coins, TRX took a sideways track over the past month but maintained its spot above the 20/50 EMA.
In particular, the last two weeks marked an uptick in price levels as the bulls strived to snap the $0.0702-level hurdle.
An inability to close beyond this barrier level could extend the consolidation phase in the coming sessions. At press time, TRX was trading at $0.06997.
TRX Daily Chart

TRX witnessed a sharp recovery after dropping towards its yearly low on 15 June. The revival from its long-term support entailed a rectangle bottom structure on the daily chart.
While the bulls forced a bullish crossover on the 20 EMA (red) and the 50 EMA (cyan) after nearly two months, TRX revealed the build-up of its underlying buying edge. To top this off, the altcoin saw an ascending triangle-like structure as the flatter peaks accompanied the higher troughs.
A sustained incline beyond the immediate resistance could open doorways for a retest of the $0.0704-$0.0706 range.
To sway above the constraints of its compression boundaries, TRX bulls must propel a much-needed hike in trading volumes. The break above the $0.0702-mark could serve as a reliable trigger for its press time bullish bias.
Rationale
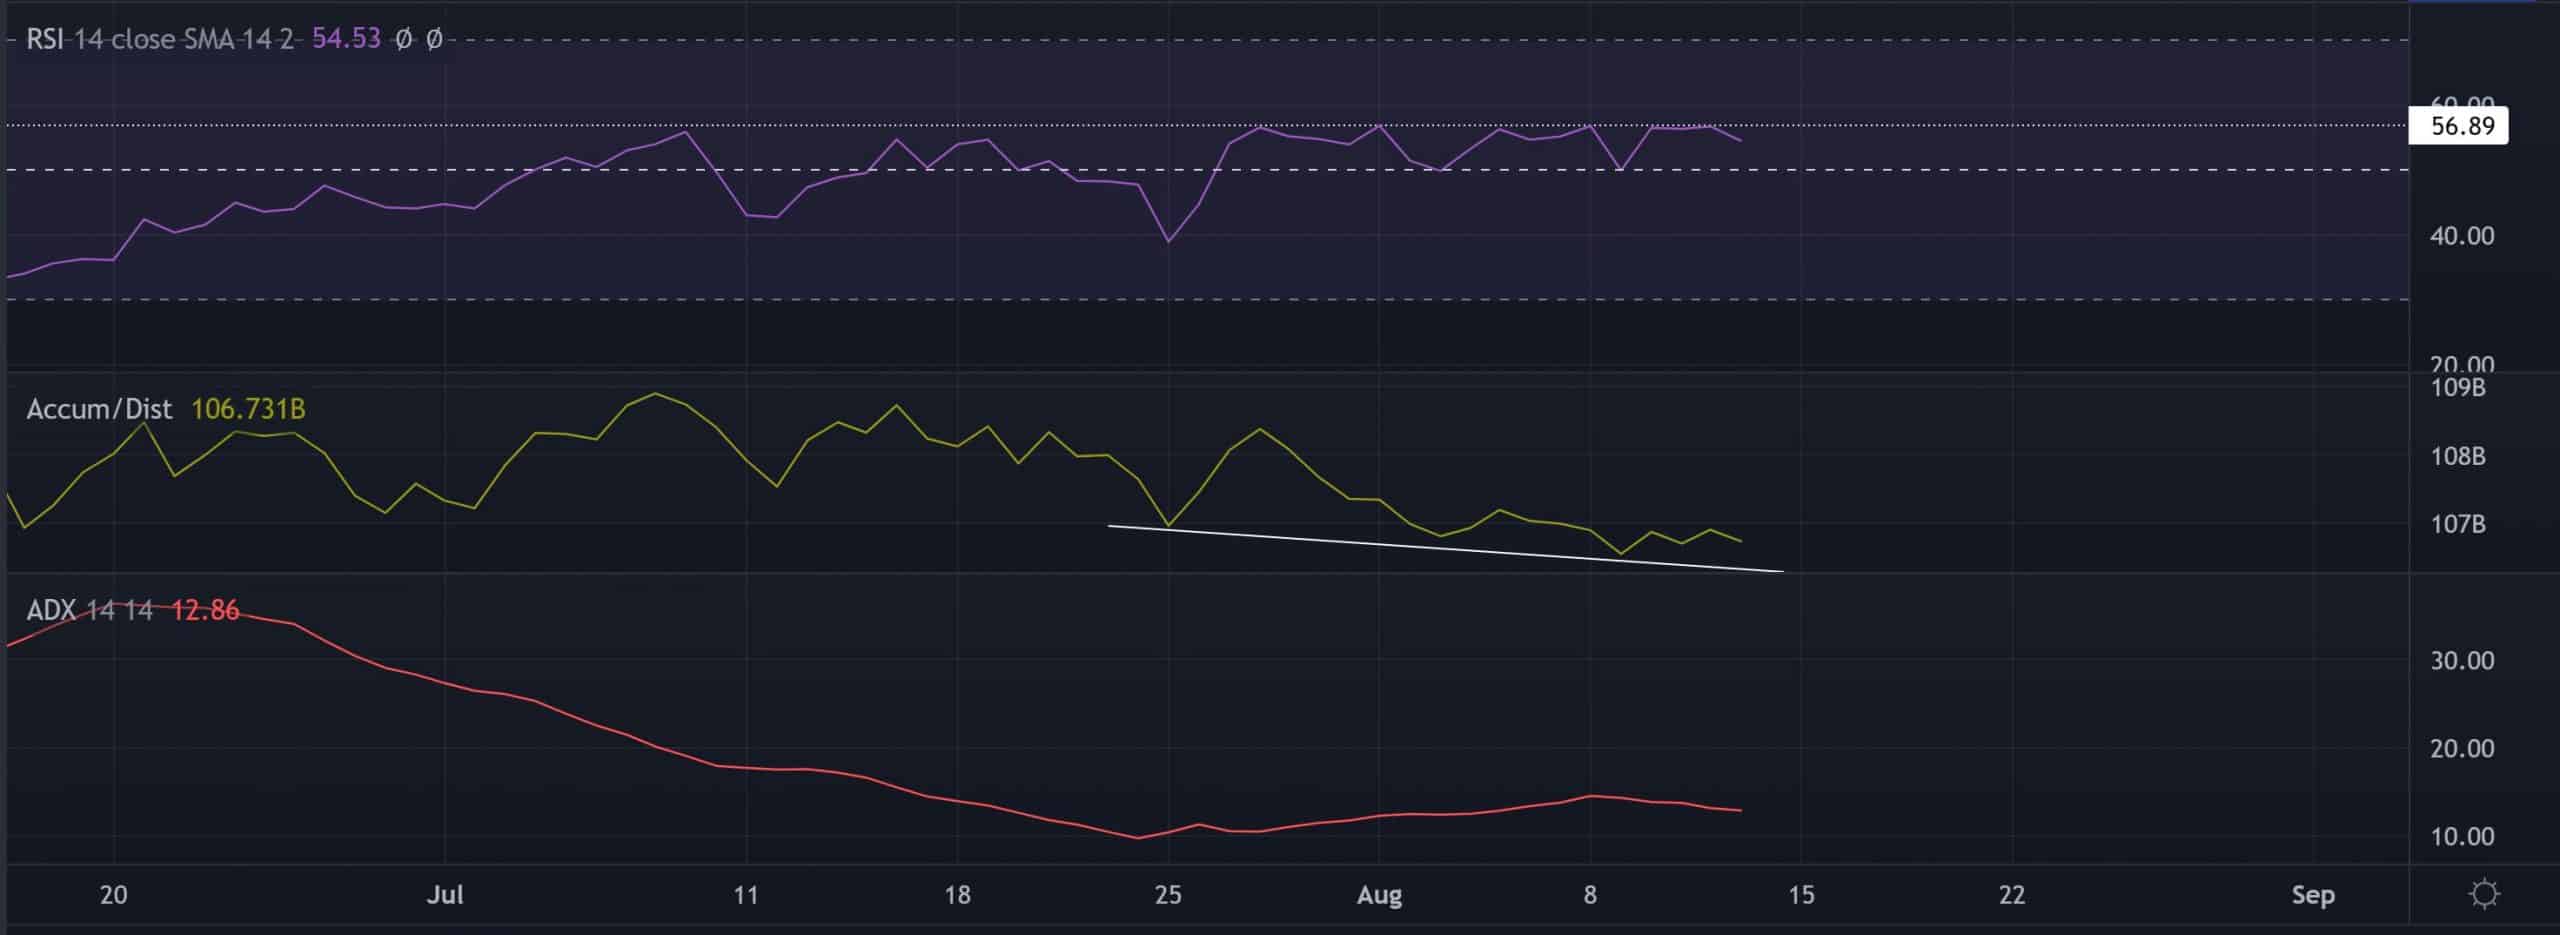
The Relative Strength Index (RSI) maintained its position above the midline, but was yet to topple the 56-mark to confirm strong revival chances.
The Accumulation/Distribution (A/D) indicator’s lower troughs bullishly diverged with the price. Any rebound from its trendline support could foster an accumulation phase. However, the ADX continued to project a significantly weak directional trend for the altcoin.
Conclusion
Given the bullish pattern setup after a bullish crossover on the 20/50 EMA, TRX could see sustained growth. Any drop below the near-term EMAs could invalidate the convincing bullish tendencies. The targets would remain the same as above.
Finally, investors/traders should consider Bitcoin’s movement and its impact on broader market perception to make a profitable move.