TRON crypto’s 2500-day high – What this surge means for your TRX holdings
- TRON’s 20% weekly surge signals strong bullish momentum, with key resistance at $0.20 and support at $0.1653.
- On-chain data shows stable network growth and institutional interest, reinforcing the rally’s potential for further gains.
TRON [TRX] has surged by 20% over the past week, reaching a 2500-day high with the price currently sitting at $0.1986 at press time. This impressive rise has caught the attention of both traders and investors, signaling a strong bullish trend.
As TRON continues its upward movement, many are wondering whether this momentum can be sustained. Let’s take a deeper look at the technicals, on-chain data, and liquidation trends to understand the driving forces behind this rally.
What’s behind TRON’s price surge?
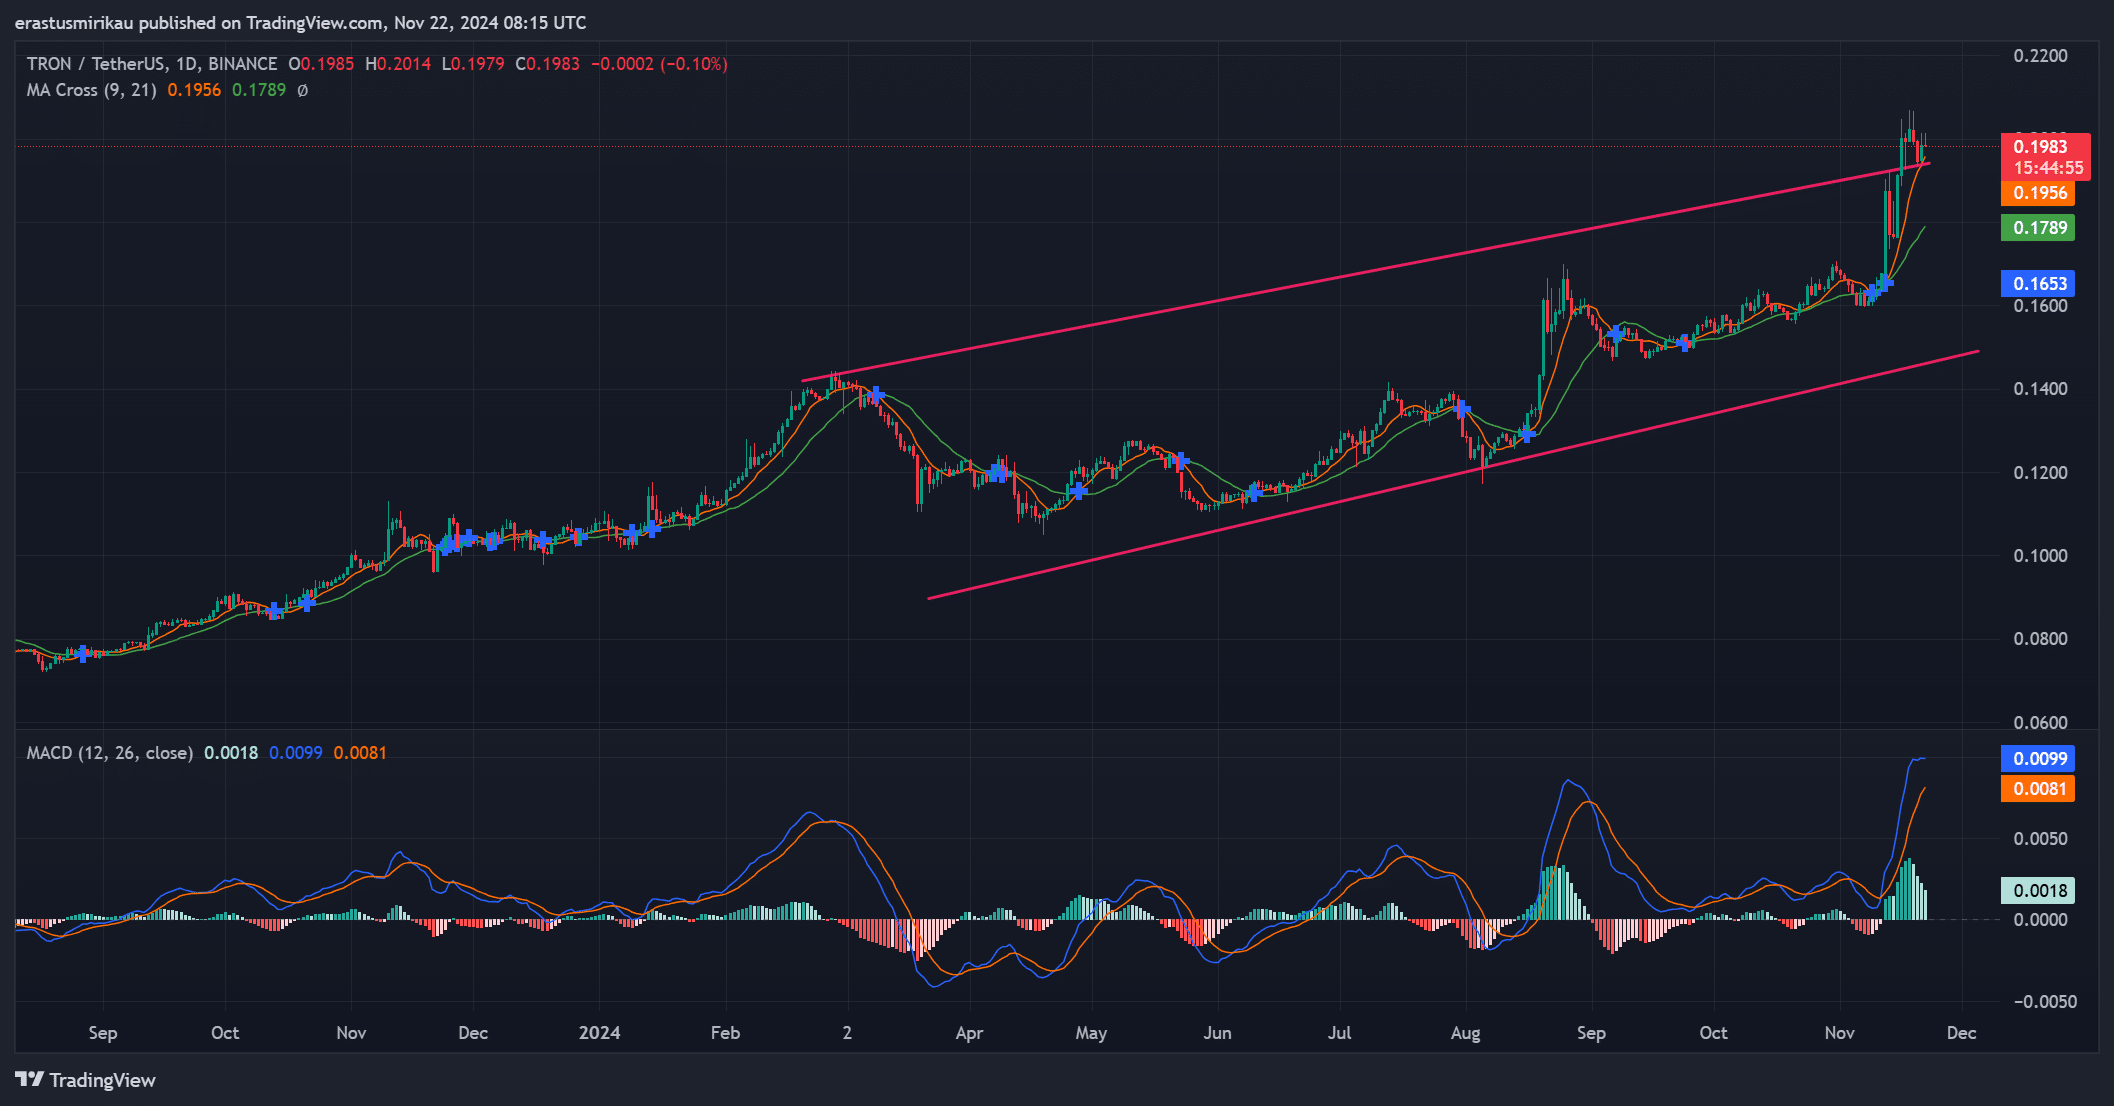
TRON has followed a clear upward trend, moving comfortably within an ascending channel. The price recently broke through key resistance levels and surged to $0.1983, showing a strong bullish outlook.
However, TRON now faces immediate resistance around $0.20. If TRON can break through this level, it could quickly target $0.22 as the next key resistance. Therefore, the upward trend will continue as long as the price stays above crucial support levels.
Looking at support, $0.1653 remains a strong level. This is where the price has previously found solid footing during minor retracements. If TRON faces a pullback, this level could act as a base for a potential bounce.
The $0.20 resistance remains the immediate barrier, and $0.22 is the next significant resistance to watch. A successful breakout above these levels could see TRON pushing toward even higher prices soon.
Additionally, the 9-period Moving Average(MA) has crossed above the 21-period MA, signaling strong short-term momentum. This MA cross is typically a bullish signal, suggesting that TRON’s price could continue to rise.
Furthermore, the MACD indicator confirms the uptrend, with the MACD line (blue) positioned above the signal line (orange). This indicates that buying pressure remains strong, supporting the continuation of the rally.
On-chain signals: Is the network supporting the rally?
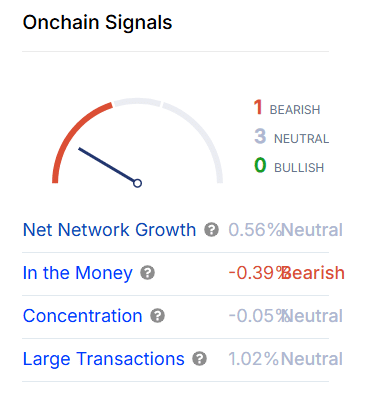
On-chain data reveals neutral sentiment. Net Network Growth has increased by 0.56%, suggesting stable activity. However, the In-The-Money ratio sits at -0.39%, indicating some bearish pressure.
Despite this, large transactions have increased by 1.02%, signaling strong interest from institutional traders, which could fuel further price action.
Total liquidations: What’s the impact?
The total liquidations chart shows $35.68 million in liquidations, with short liquidations dominating. This suggests that traders betting against TRON have been forced out of their positions, adding to the bullish momentum.
The forced buying pressure from short liquidations has likely contributed to the continued upward movement.
Read TRON’s [TRX] Price Prediction 2024-25
Can TRON sustain its bullish momentum?
TRON’s 20% weekly surge is supported by strong technical indicators, including the MA cross and MACD. As the price approaches key resistance levels at $0.20, a breakout could propel the price toward $0.22.
On-chain signals show steady network growth and increased interest from institutional investors. Therefore, as long as TRON stays above $0.1653, it looks poised for further gains in the near term.

