TRON has seen strong demand recently, but traders should be cautious about…

Disclaimer: The findings of the following analysis are the sole opinions of the writer and should not be considered investment advice
Bitcoin continued to range between the $28.7k support level and the $30.6k resistance level. At press time, Bitcoin was trading at $29.8k, near the mid-point of this two-week range. TRON saw a bullish performance on the charts in the past few days, after the price oscillated for a few days about the $0.07 zone of demand. Despite the bullish short-term structure, it was possible that TRON would see a pullback in the hours to come due to a reversal pattern.
TRX- 1 Hour Chart
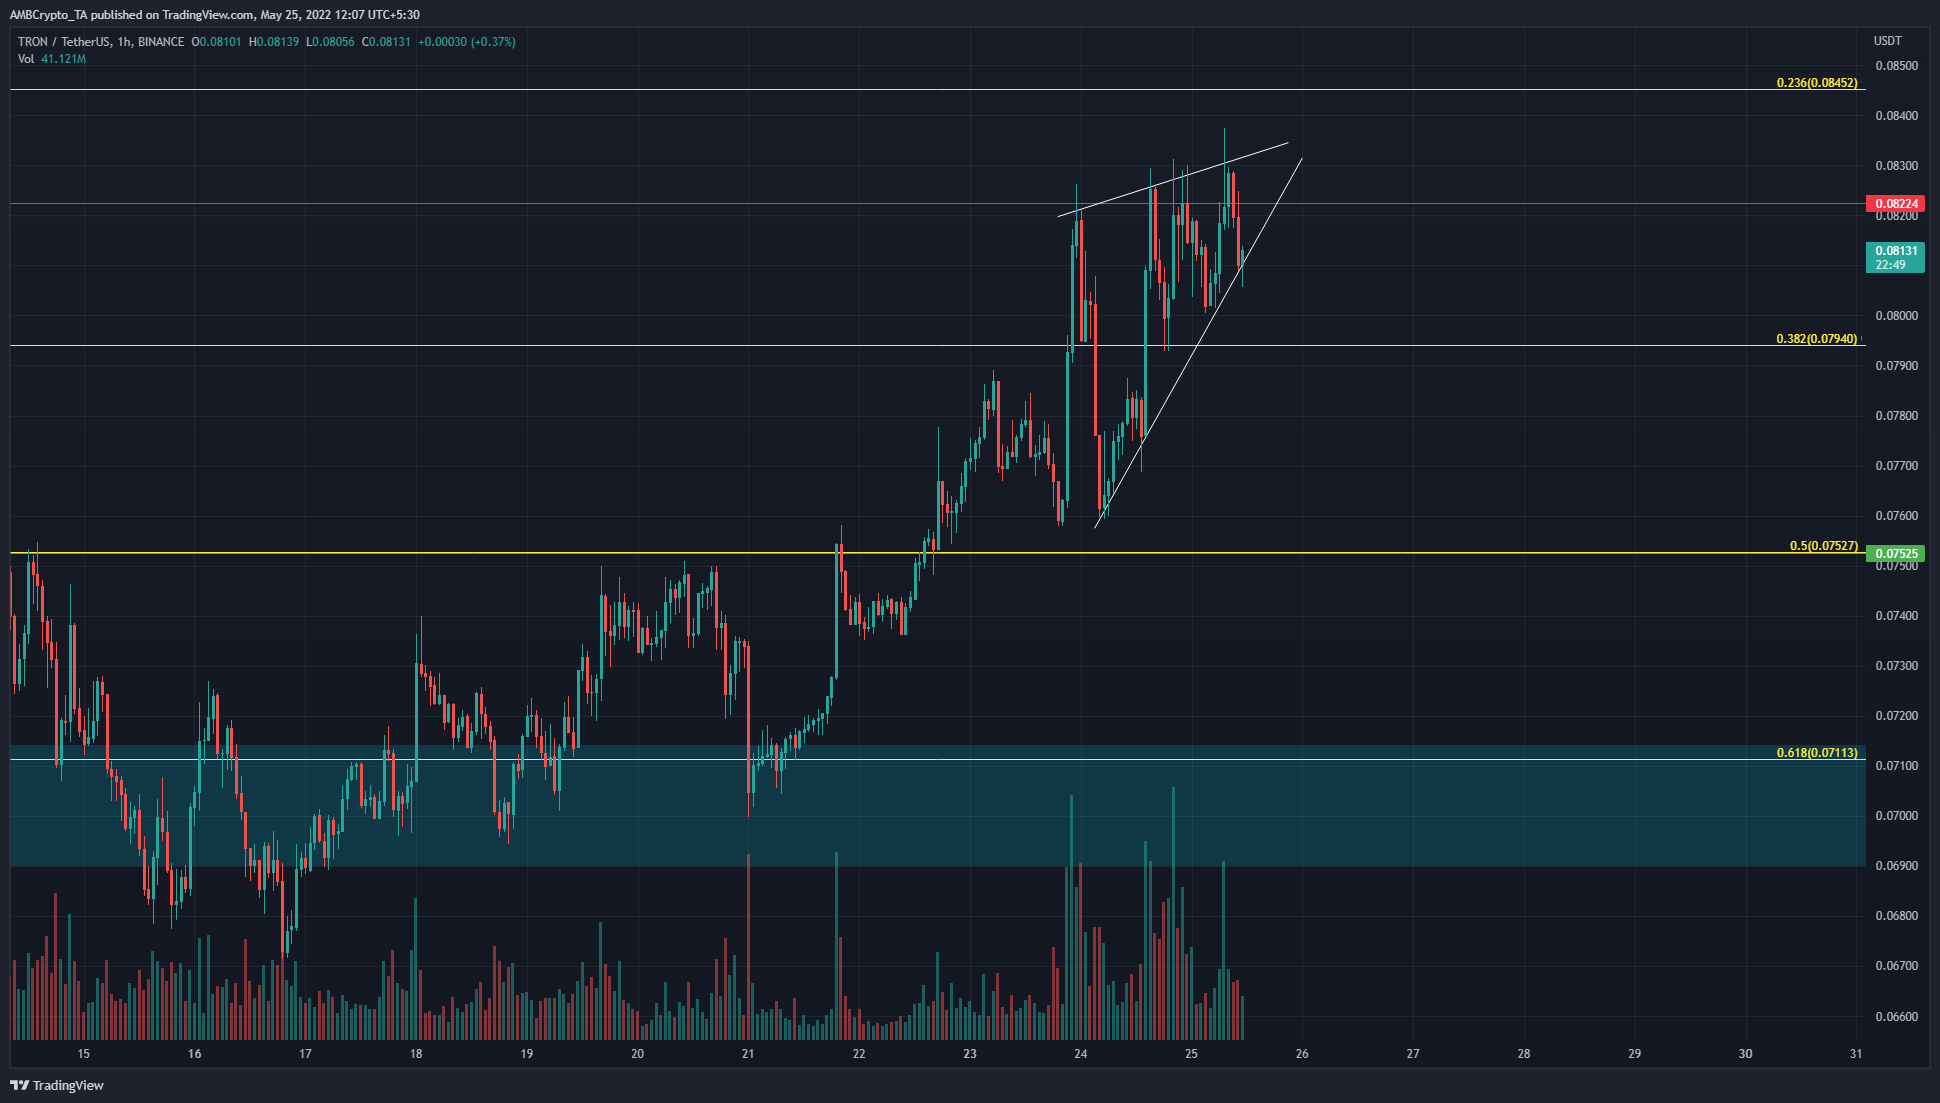
TRX has performed quite well in the past few days as it posted gains of 15% in the past five days, even though Bitcoin was trading within a range. In the past few days, the trend has been bullish as there were a series of higher lows and higher highs set on the charts after TRX dipped to $0.068. Since then, the price has tested the $0.07 area as demand and climbed higher.
The price formed an ascending wedge pattern (white) on the hourly chart, just as it ran into the $0.082 resistance level. Therefore, it was possible that a pullback to the base of the pattern at $0.0775 or $0.076 could be seen.
Moreover, the trading volume has been quite high over the previous day, which suggested that bulls had been trying quite hard to break past the $0.082 resistance but to no avail.
A pullback would become more likely if TRX sees a session close beneath the lower trendline, and the $0.0775 area could offer a buying opportunity.
Rationale
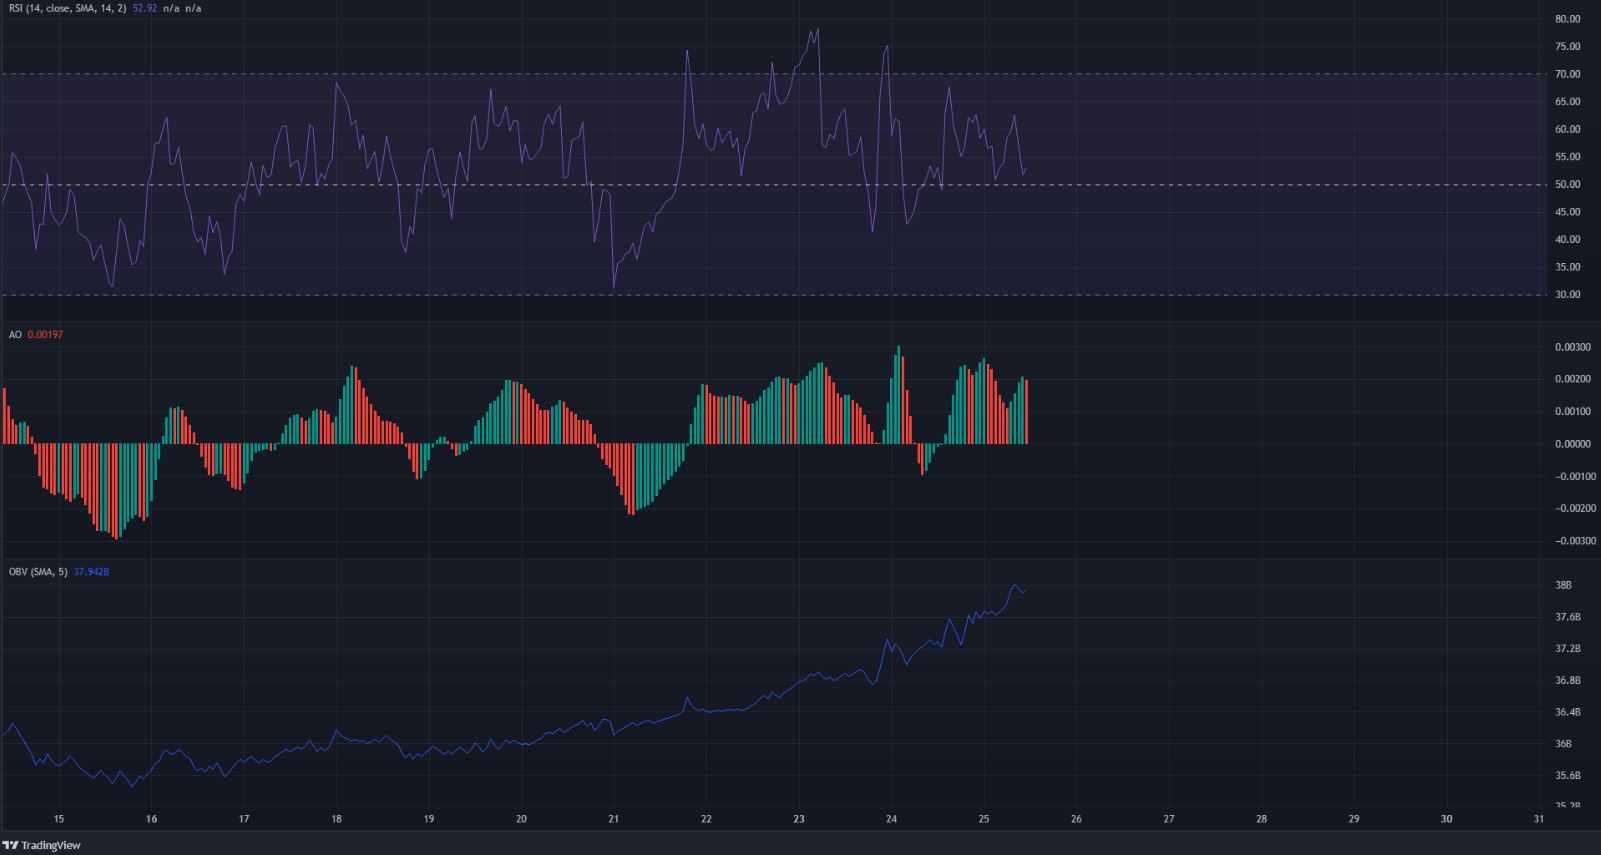
The RSI on the hourly chart has remained above the neutral 50 line for the most part in the past two weeks, and the Awesome Oscillator also continued to stay above the zero line to signal bullish momentum. However, in the past 36 hours, the price has closed higher and higher, while the RSI made lower and lower peaks.
This bearish divergence, combined with the rising wedge pattern, suggested that TRX was likely to see a dip in the next few hours. However, the OBV kept rising, alongside the uptrend in price. Therefore, there was strong buying volume behind the uptrend of TRX, and a dip would likely be followed by further gains.
Conclusion
The $0.075-$0.0775 area could be tested as a demand zone provided a pullback does occur. This area has been a strong short-term support area, and a bounce from this zone was likely. The rising wedge pattern would be invalidated if TRON climbs past the $0.082 level and retests it as support.


