Tron hits ATH: Is $0.234 just the start for TRX?

- TRX’s trading volume increased along with its price.
- Technical indicators hinted at a continued price rise.
Tron [TRX] has once again made it to the headlines as it recently reached an all-time high(ATH) as robust trading activity supported the development.
With this new ATH, TRX inches closer to entering the top 10 list. Will TRX be able to flip Avalanche [AVAX] and claim the 10th spot, or will it be subjected to a pullback first?
Tron’s touches an ATH!
Tron bulls drove the token price up by over 28% last week. In the last 24 hours alone, TRX surged by more than 16%, reaching an all-time high of over $0.234.
Currently, the market capitalization difference between TRX and AVAX is around $1 billion. If TRX continues its upward movement, it might surpass AVAX to become the 10th largest cryptocurrency by market cap.
Will TRX continue to pump?
To assess the likelihood of TRX continuing its bull run, AMBCrypto analyzed the token’s on-chain metrics.
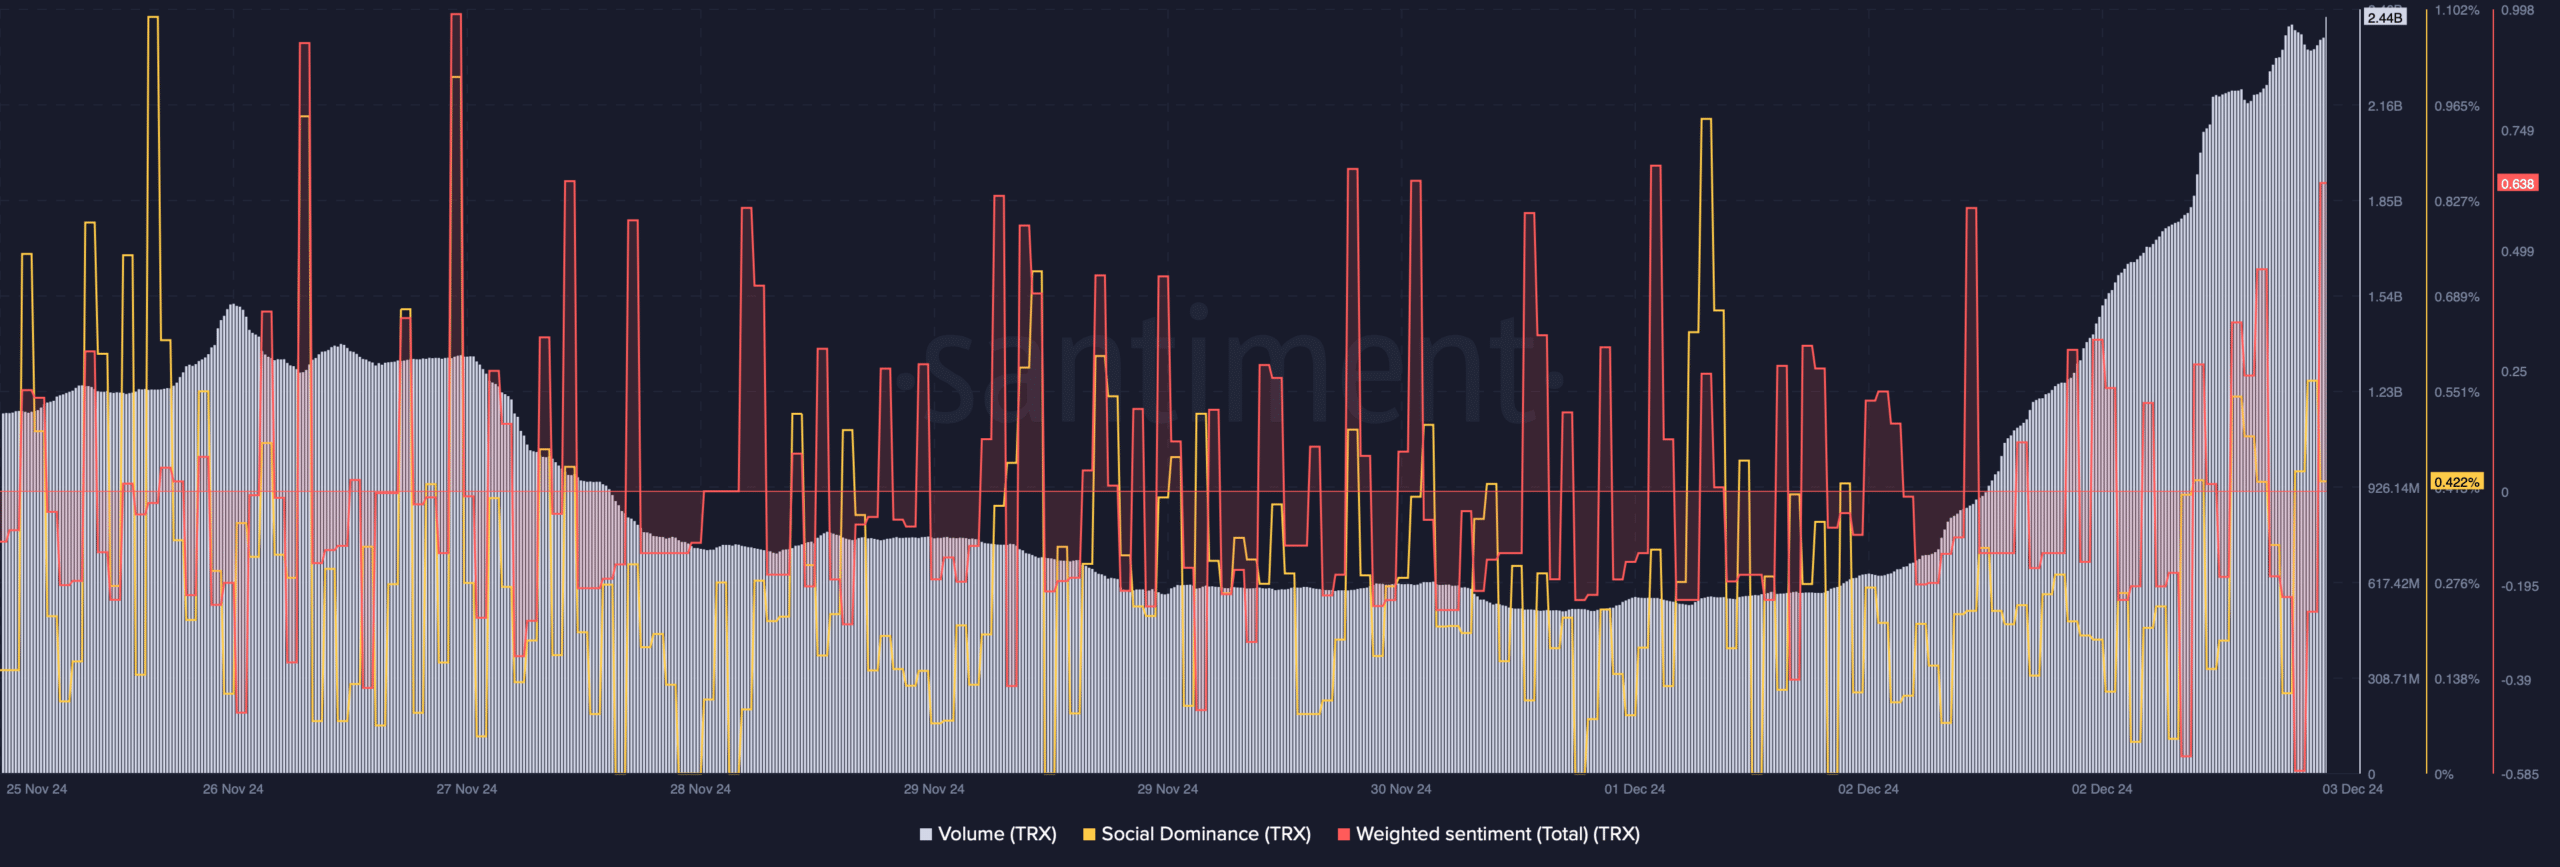
According to Santiment’s data, TRX’s trading volume significantly increased alongside its price. A rise in volume during a bull run further strengthens the upward momentum.
The recent price uptick also positively impacted the token’s social metrics. For instance, its social dominance remained high, reflecting TRX’s popularity in the crypto space.
However, despite reaching an ATH, TRX’s Weighted Sentiment dropped soon after—indicating rising bearish momentum.
Nonetheless, the token’s derivatives metrics looked optimistic. Coinglass’ data revealed that Tron’s funding rate increased. A rising Funding Rate in crypto indicates that the market is optimistic and that traders expect prices to rise.
This is because traders who believe prices will increase are willing to pay extra to keep their long positions.
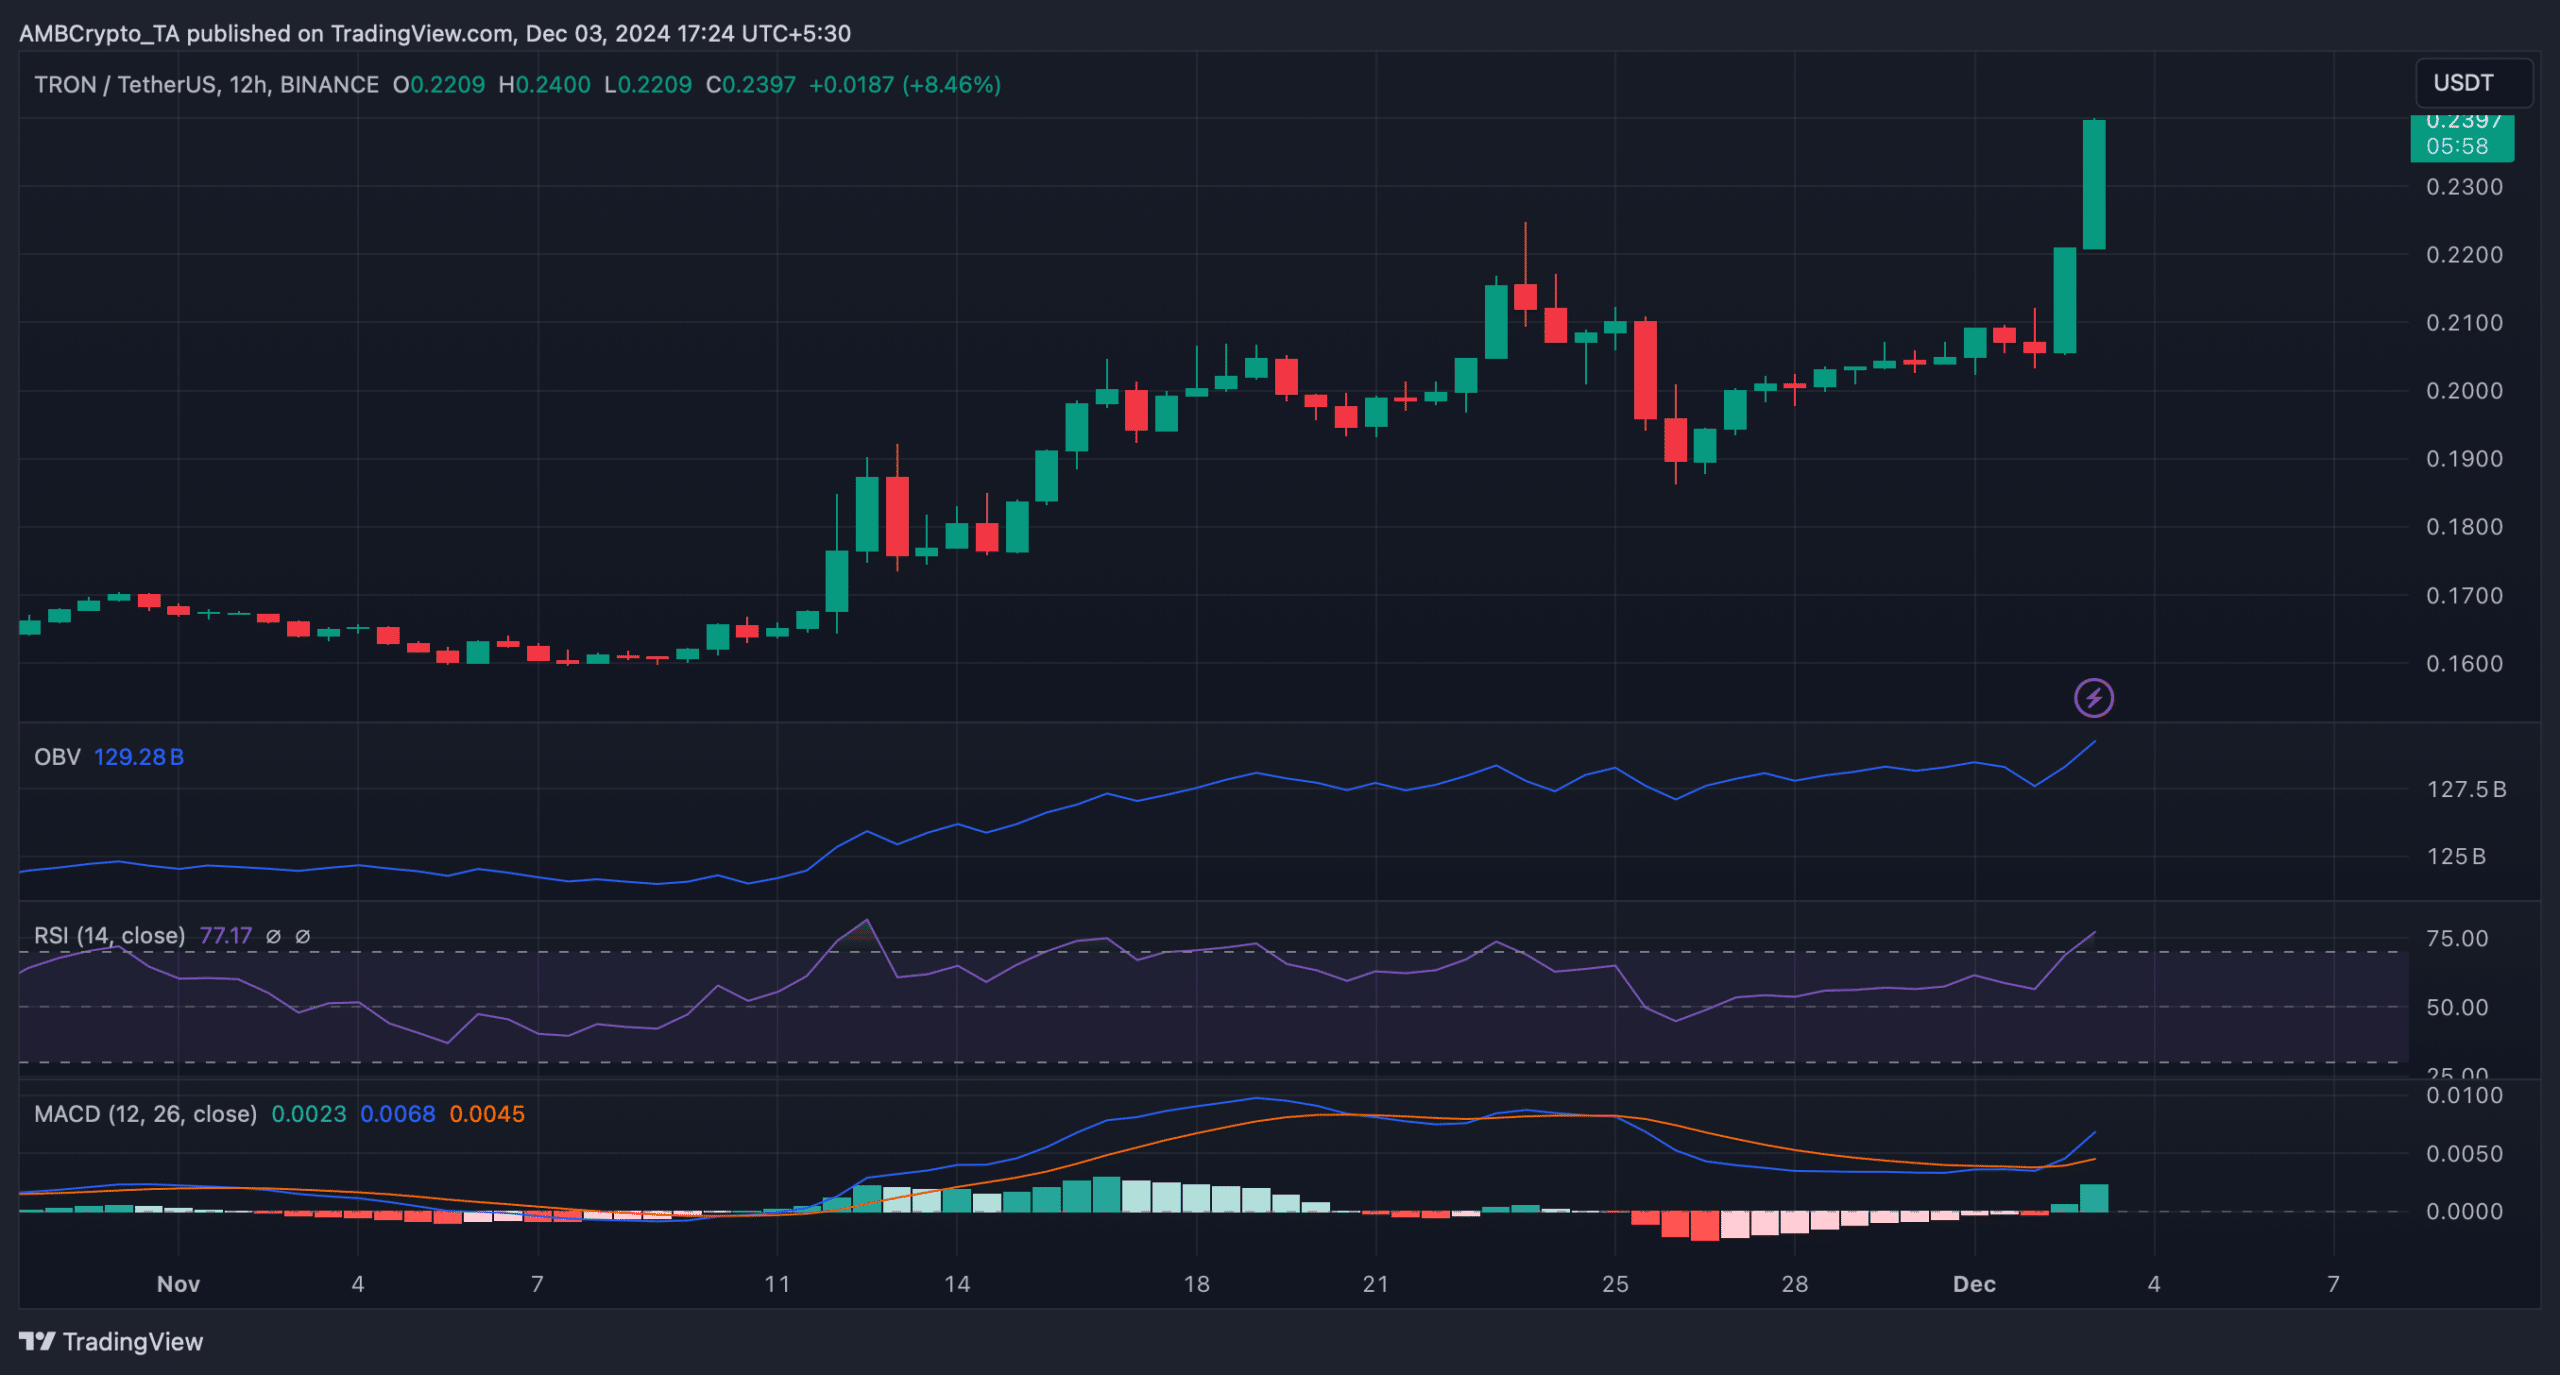
The technical indicator On Balance Volume (OBV) registered an uptick — indicating that the trading volume on days with positive price movements was greater than the volume on days with negative price movements.
TRX’s MACD also displayed a clear bullish advantage, suggesting a continued price rise. However, Tron’s Relative Strength Index (RSI) entered the overbought territory.
This might motivate investors to sell and, in turn, push TRX’s price down.
Read TRON’s [TRX] Price Prediction 2024-25
Interestingly, as TRX reached new highs, its network activity also saw an uptick. Artemis’ data shows a sharp increase in TRX’s daily active addresses.
A similar increasing trend was also noted on the daily transactions graph. This meant that the new ATH was achieved with the backing of rising network activity.


