Tron: How TRX traders can leverage these two opportunities to their benefit

Disclaimer: The findings of the following analysis are the sole opinions of the writer and should not be considered investment advice.
After maintaining a position above the 20/50 EMA for a few days, the bulls have ensured immediate support near the 38.2% Fibonacci support. The decline from the $0.069-level reignited the bearish efforts in pulling TRON [TRX] toward its 20 EMA (red).
Furthermore, with the three-week trendline support (white, dashed) standing sturdy, the bulls could aim for a patterned breakout in the coming sessions.
A rebound from the 20 EMA could hint at a near-term recovery before a possible reversal from the $0.07-zone. At press time, TRX was trading at $0.06709, down by 0.55% in the last 24 hours.
TRX 4-hour Chart
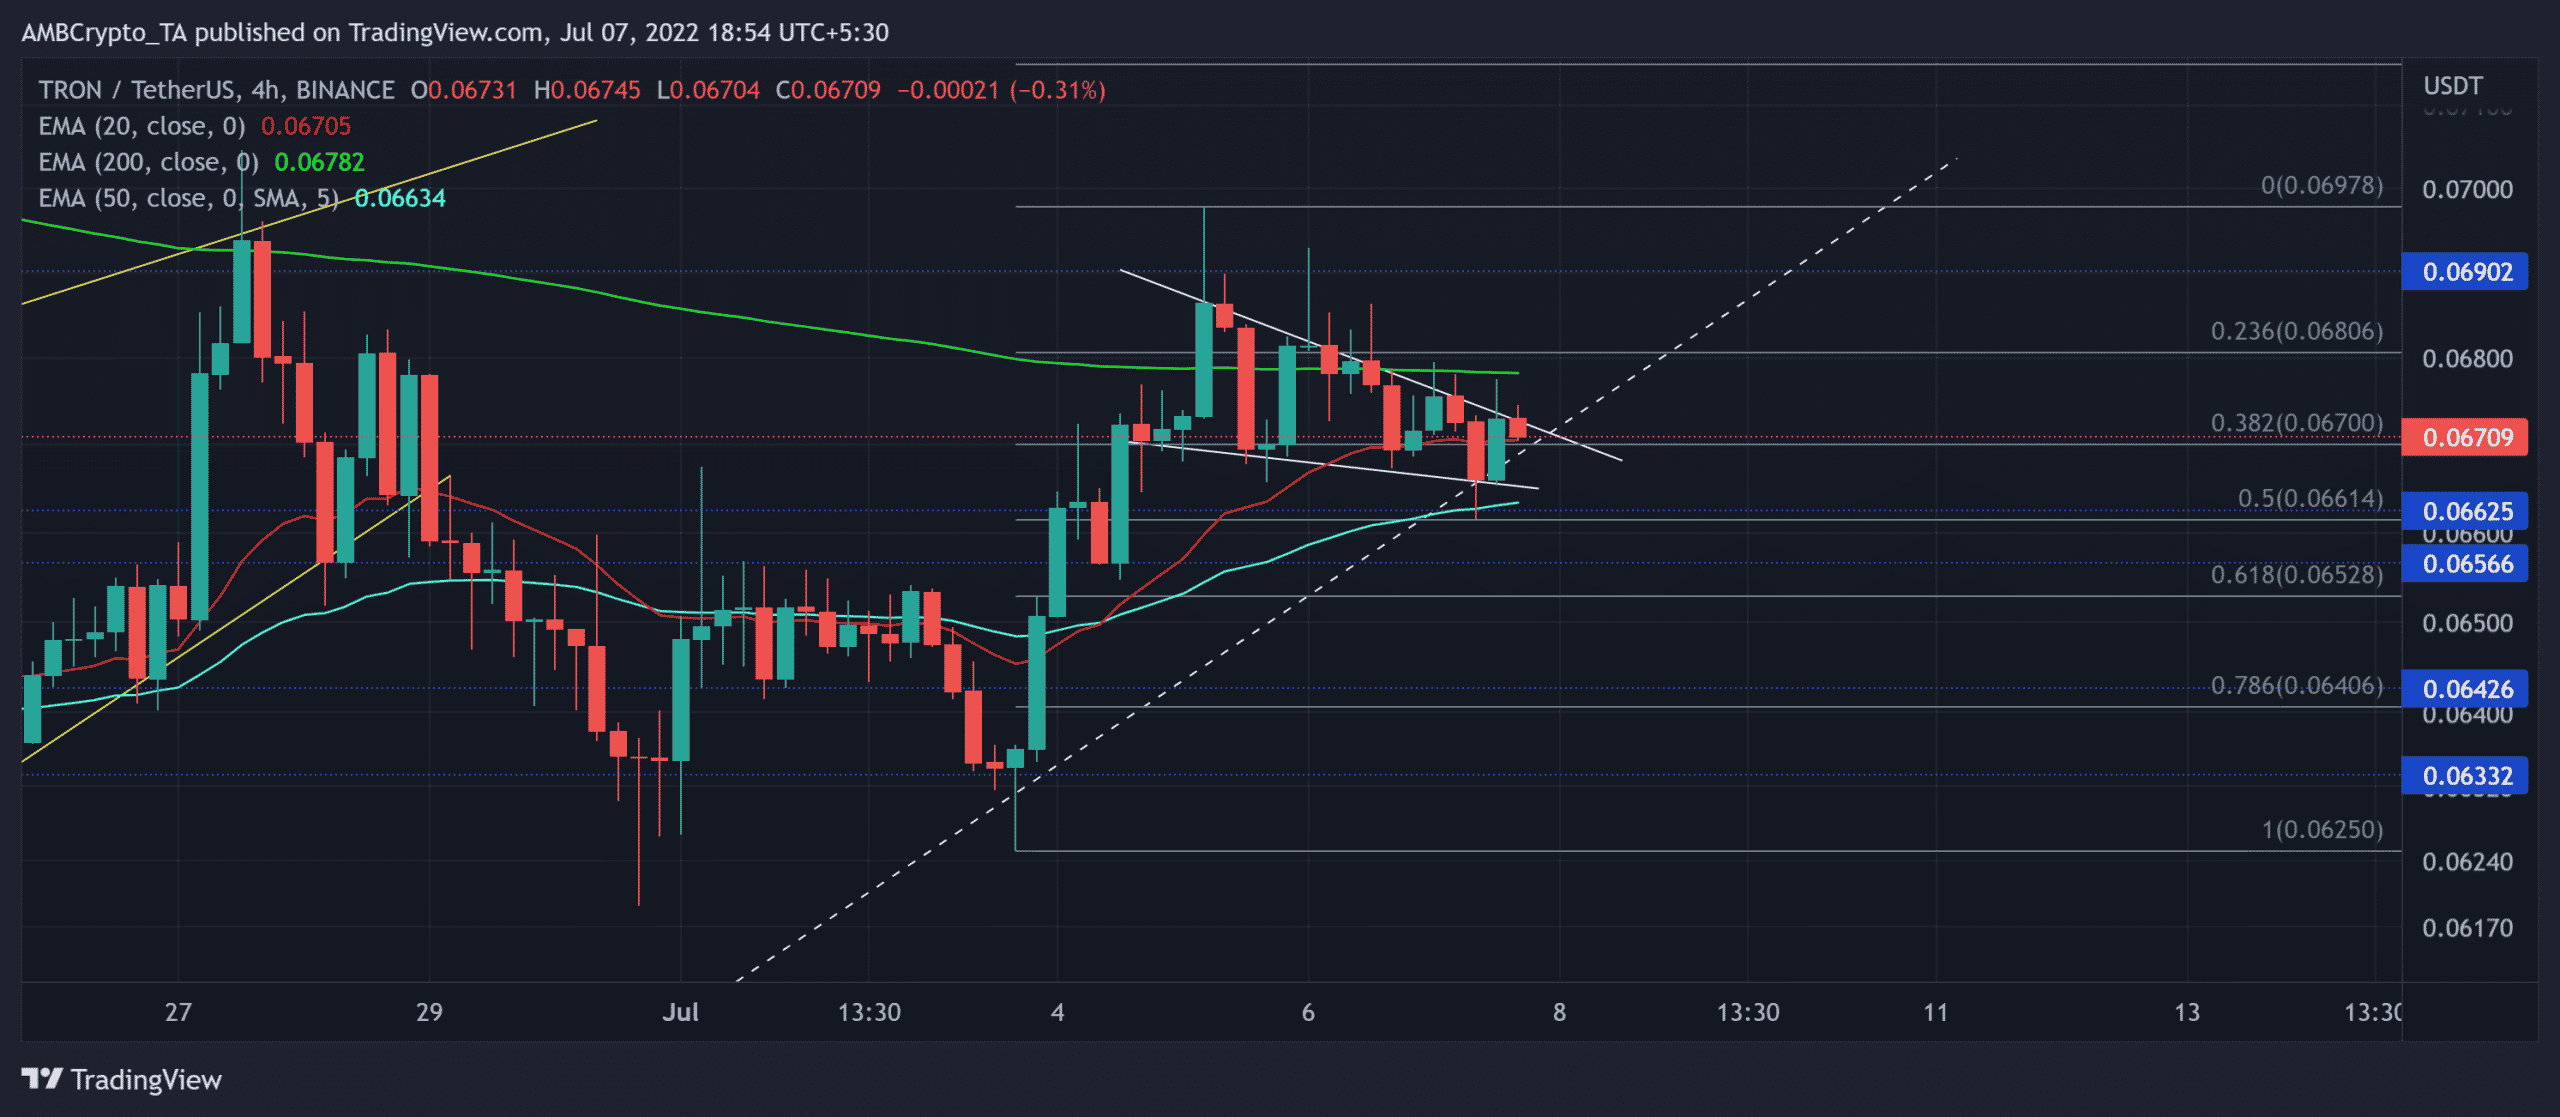
TRX saw gradual improvements after dropping towards its yearly low on 15 June. The recovery from its long-term support entailed trendline support that lasted for over three weeks.
The buyers revealed their near-term edge, especially with the price action jumping above the 20/50 EMA. As a result, the TRX saw a bullish pennant-like structure in the four-hour timeframe.
A continued bullish momentum can help TRX break above the current pattern. In this case, the 200 EMA can cap the buying efforts from near the $0.07-zone. Traders should look for rebounding signals from this region.
In case of a bullish invalidation, the alt could see a drop until the 61.8% Fibonacci support near the $0.065-zone. Investors/traders must carefully assess the broader macro-economic sentiments affecting placing short bets.
Rationale
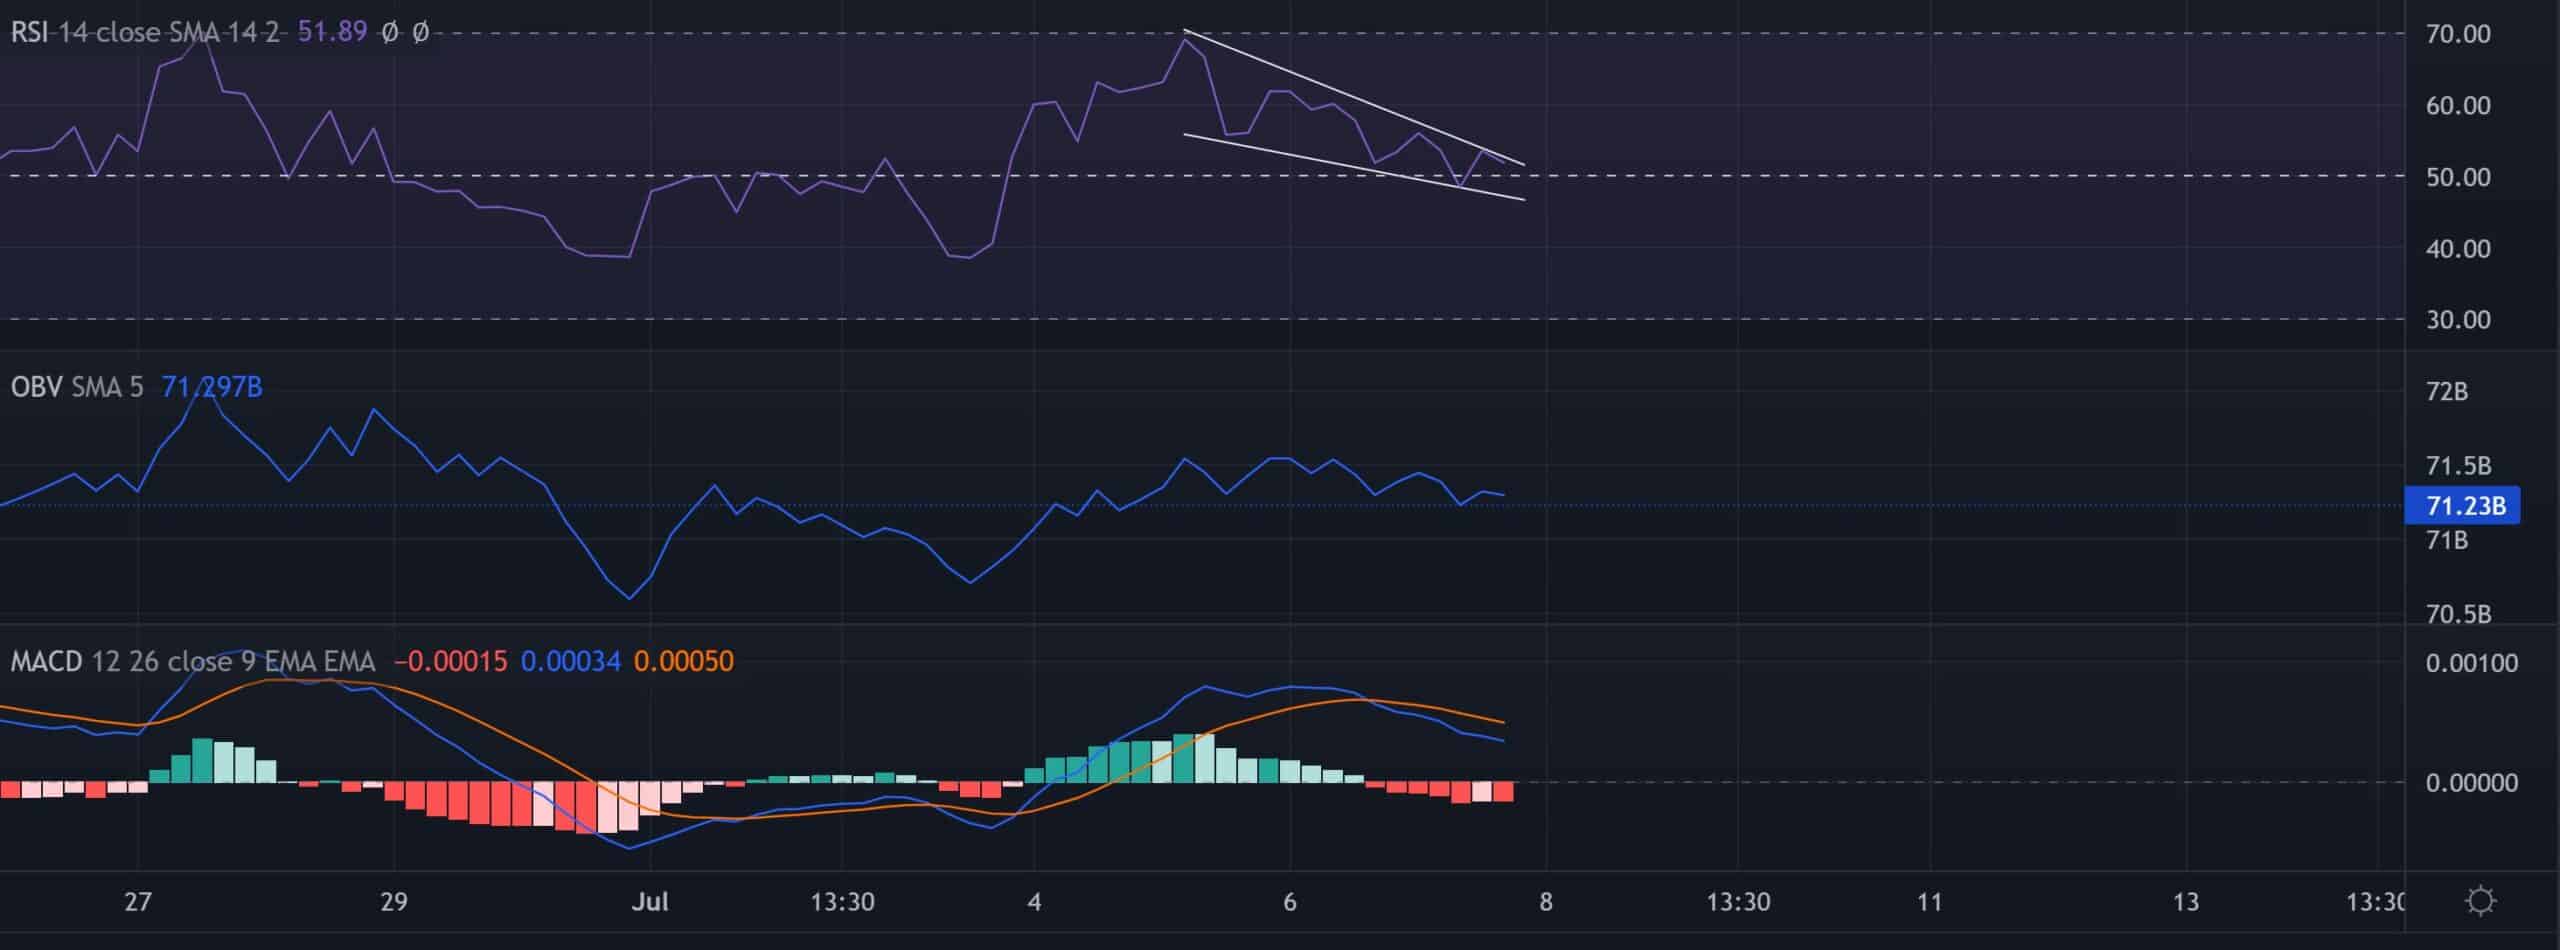
The Relative Strength Index (RSI) saw a stiff reversal from the overbought mark. Meanwhile, it formed a falling wedge whilst approaching the midline. Any reversals from the 50-level could inflict a patterned breakout and aid the buyers in propelling a rally.
Further, the On-Balance Volume (OBV) maintained its immediate support despite the price action’s lower troughs. Thus, revealing a slight bullish edge. Finally, the Moving Average Convergence Divergence (MACD) lines still needed a bullish crossover to claim a superior edge.
Conclusion
Given the current setup near the 38.2% support, TRX could see a bounce-back before falling back into a bearish zone. The targets would remain the same as above.
Finally, investors/traders should consider Bitcoin’s movement and its impact on broader market perception to make a profitable move. An analysis of this would aid traders in anticipating the possibility of any bearish invalidations.