Tron impresses on these fronts but clouds of concern loom over TRX as…
The Tron network seemed in a celebratory mood amid TRX's ongoing bullish price trajectory. However, it wasn't all rosy for the altcoin as a few metrics painted a glum picture for TRX.

- The total number of Tron accounts surpasses 162 million as of 26 May.
- However, the number of stakers, weighted sentiment, and volume took a hit.
Tron’s [TRX] performance over the last 30 days has been nothing short of commendable. TRX was trading at $0.06518 as of 26 April and at the time of writing, it exchanged hands at 0.077. The token surged by approximately 20% over the last 30 days.
However, the efforts taken by the network could be considered a significant reason behind this growth on the price front. A tweet posted by TRONSCAN stated that the total number of Tron accounts exceeded 162 million and stood at 162,207,183.
🎉🎉🎉Congratulations!!! #TRON's total accounts have reached 162,207,183, exceeding 162 million! #TRON ecosystem has developed rapidly and continues to make efforts to decentralize the web.
🥰Appreciation to all #TRONICS! pic.twitter.com/j0caG2ARej
— TRONSCAN (@TRONSCAN_ORG) May 26, 2023
How much are 1,10,100 TRXs worth today
TRX on a roll…
Apart from the aforementioned development, another tweet posted by Tron Community gave an update on the number of coins burned. As of 25 May, the network burned 17,304,991 TRX tokens. This was also a positive development for the token and its community.
https://twitter.com/TronixTrx/status/1661887881751699456
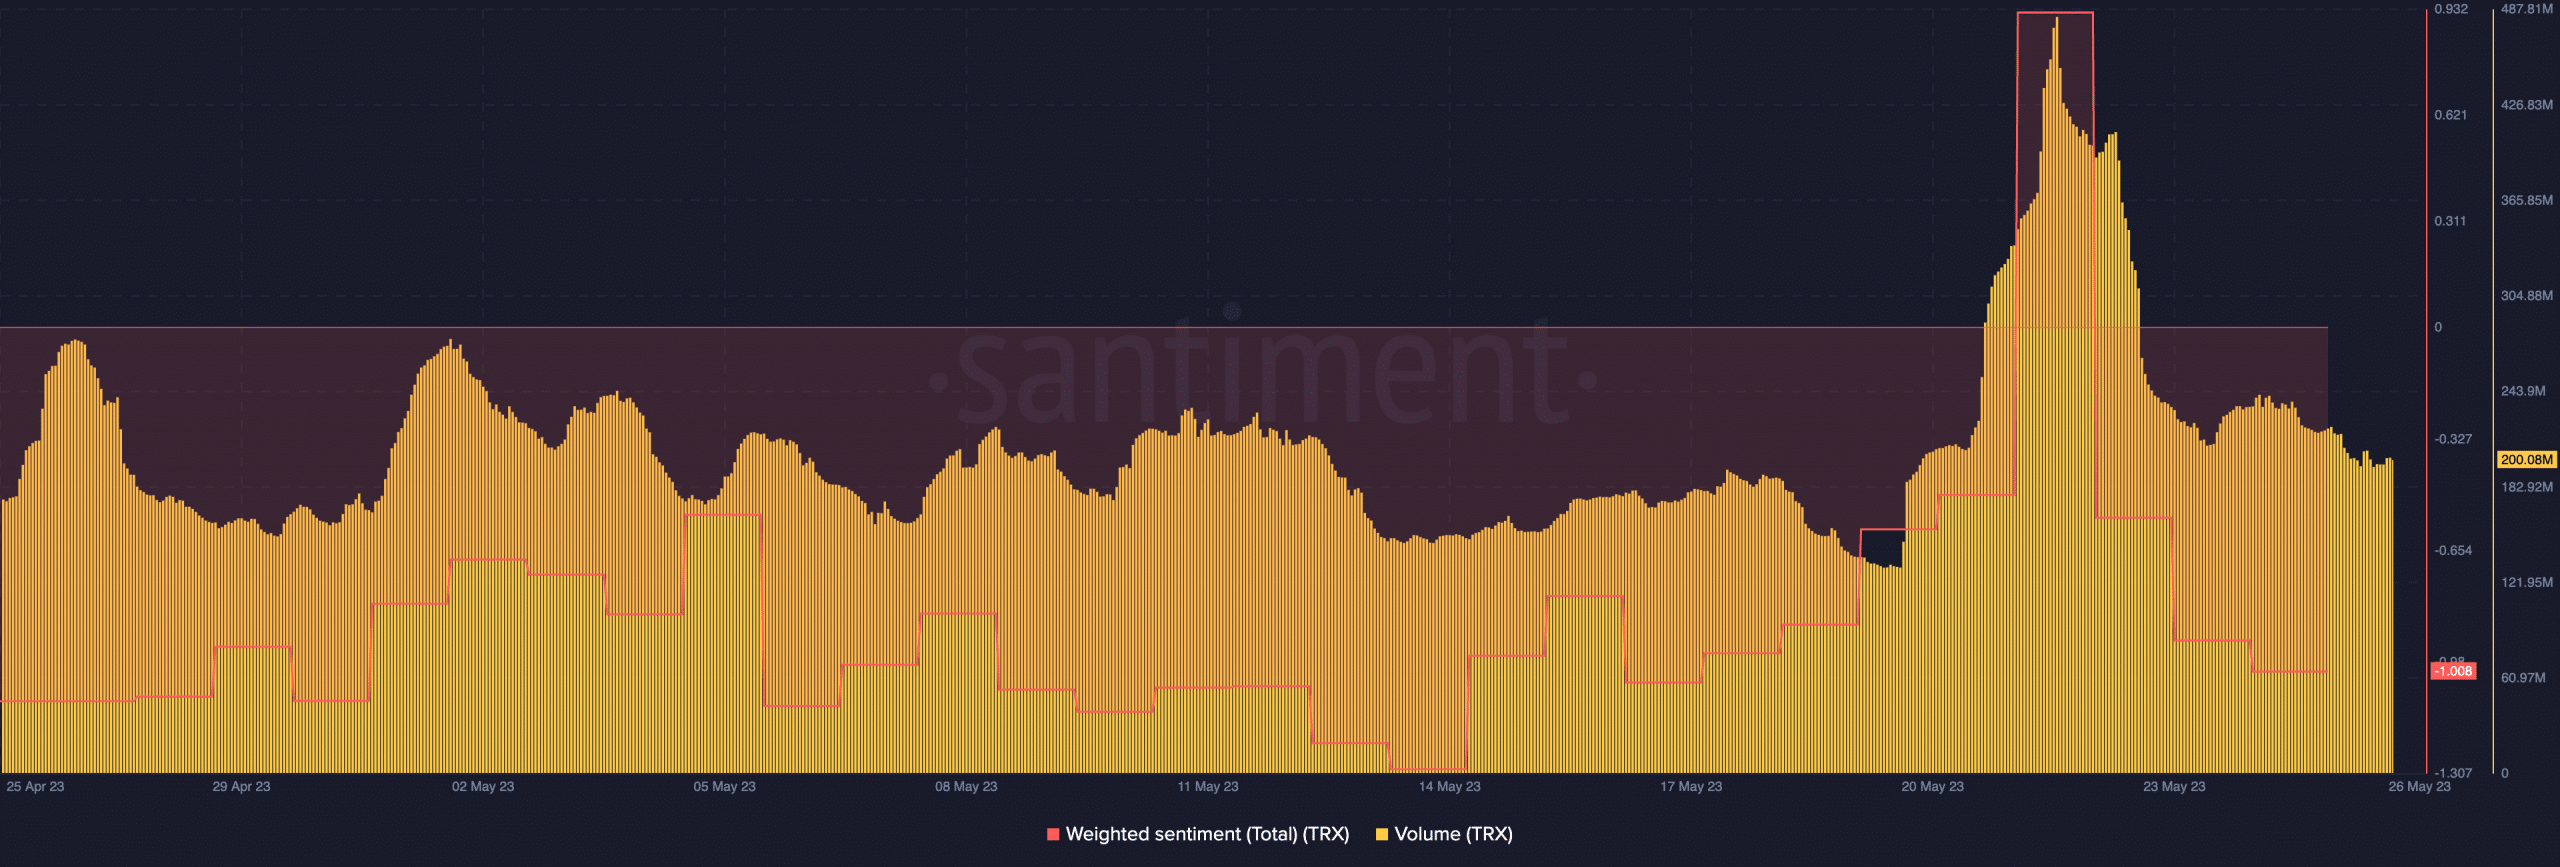
Despite the positive developments fostering a growing environment, some metrics didn’t seem to favor the community and the token. At press time, data from the intelligence platform Santiment showed that over the last 30 days, TRX weighted sentiment, as well as volume, didn’t perform very well.
At the time of writing, TRX’s weighted sentiment witnessed a significant drop after going as high as 0.922 just five days earlier on 21 May. This wasn’t a good sign for the network. Furthermore, TRX’s volume also followed a similar pattern and witnessed a notable peak on 22 May. However, it started to decline from 24 May and stood at 198.24 million.
Where does TRX stand?
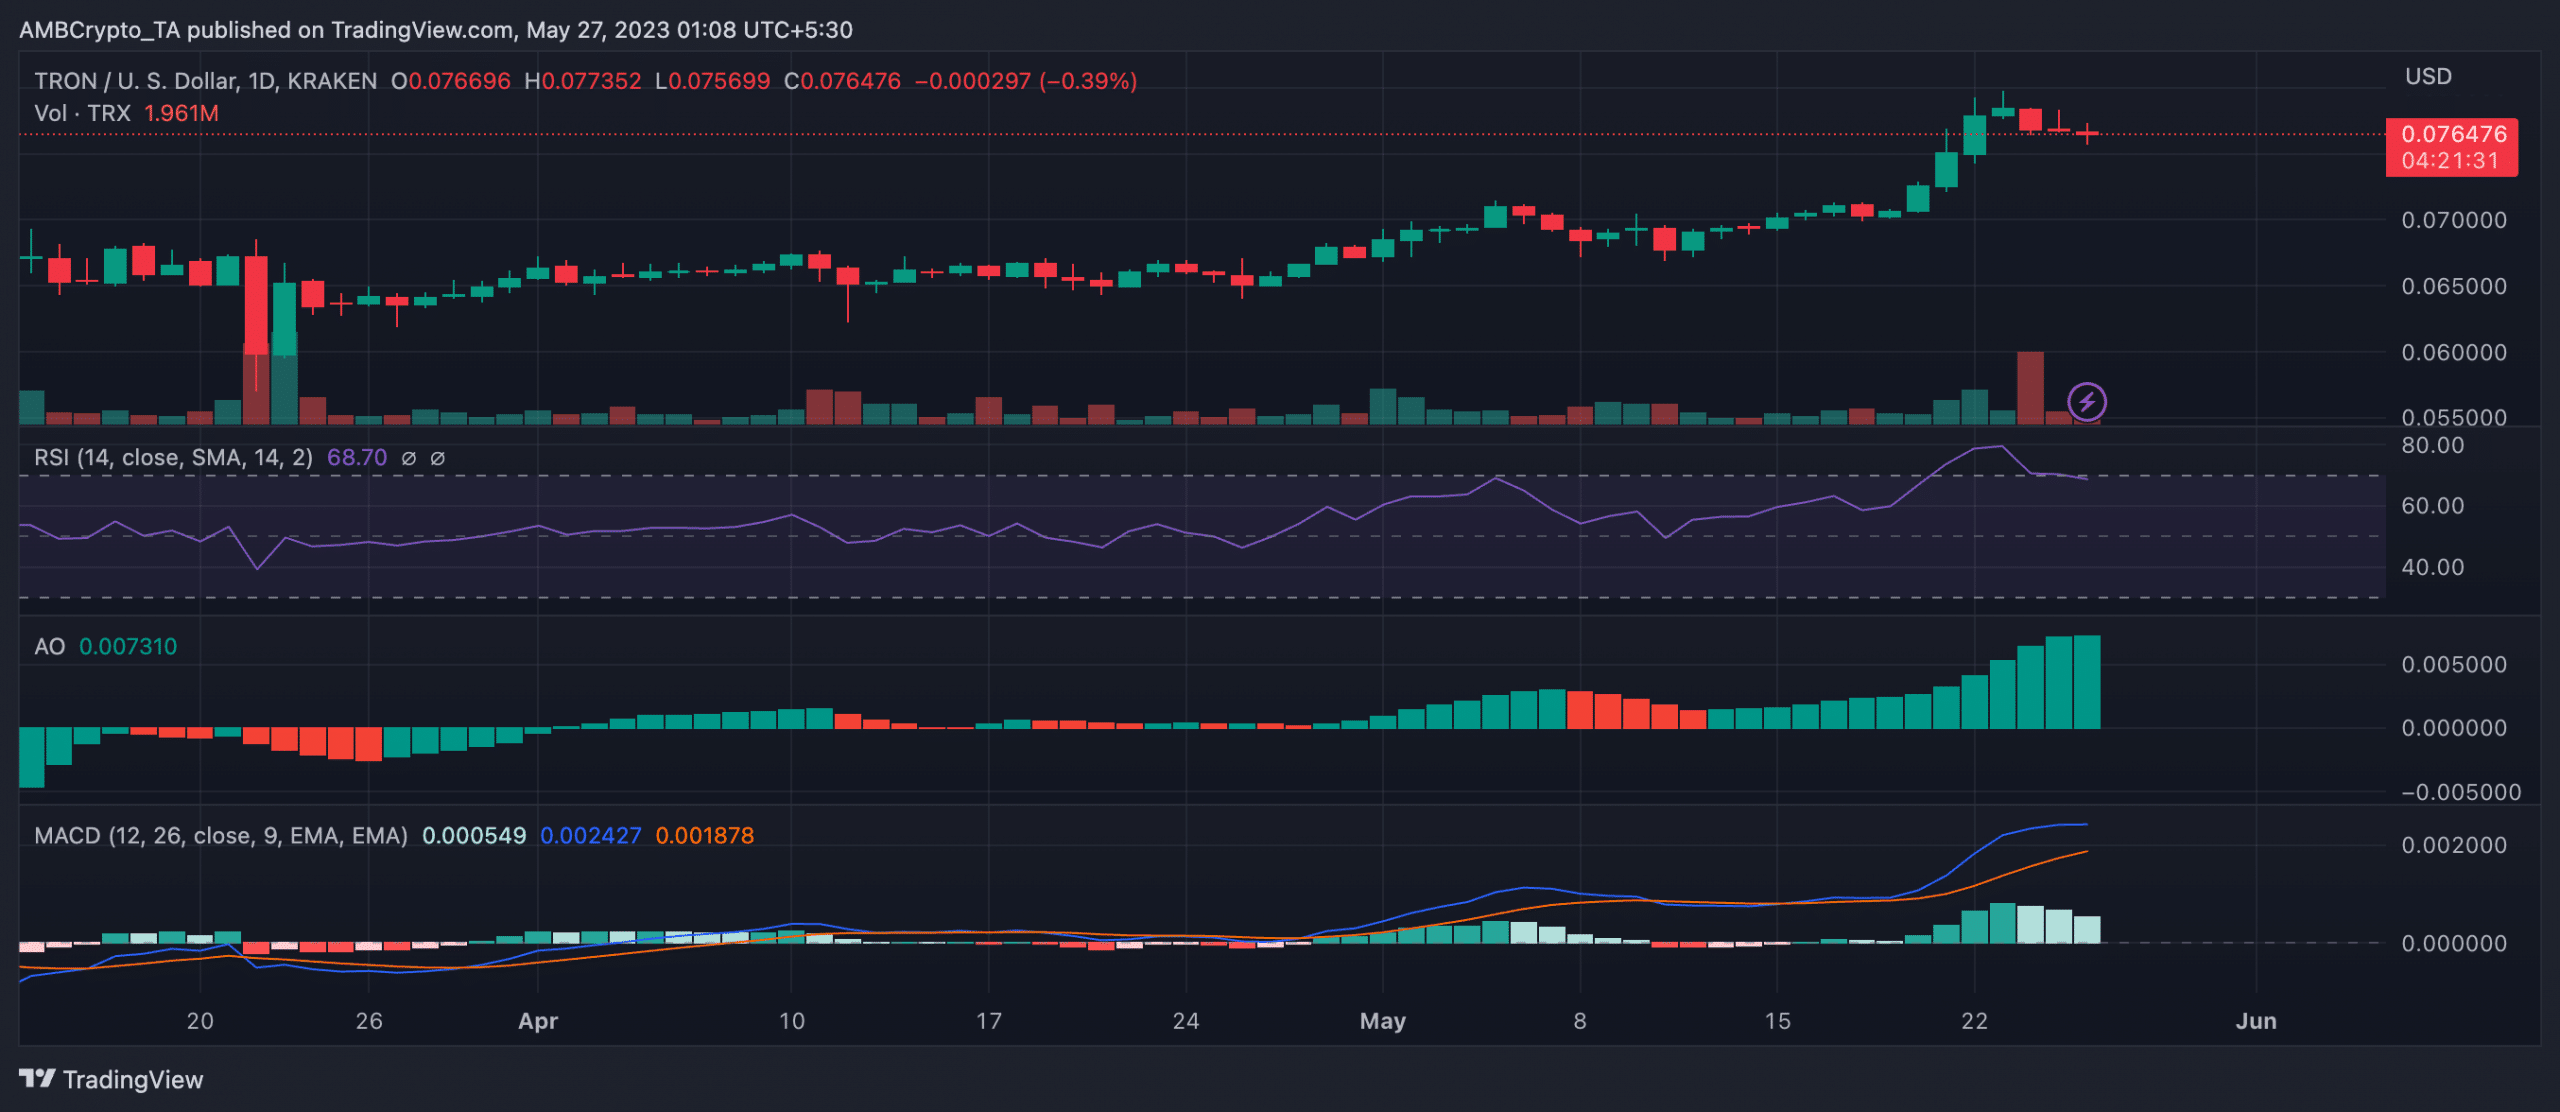
At the time of writing, TRX was trading in the red as per the chart given below. However, TRX’s Relative Strength Index (RSI) moved slightly below the oversold region to stand at 68.70. Although the RSI moved out of the oversold region, the RSI still showed the presence of buying momentum.
Furthermore, the Awesome Oscillator (AO) also flashed moved above the zero line and flashed green bars at the time of writing. This showed that TRX was on a bullish spree at the time of writing.
Another indicator of Tron’s journey in the green was the Moving Average Convergence Divergence (MACD). At the time of writing, the MACD line (blue) moved significantly above the signal line (red). This could be taken as a significant bullish indicator.
Read Tron’s [TRX] Price Prediction 2023-24
Additionally, considering the movement of both these lines also showed that the bullish crossover could go on for a while unless TRX witnesses a sudden rise in selling pressure.
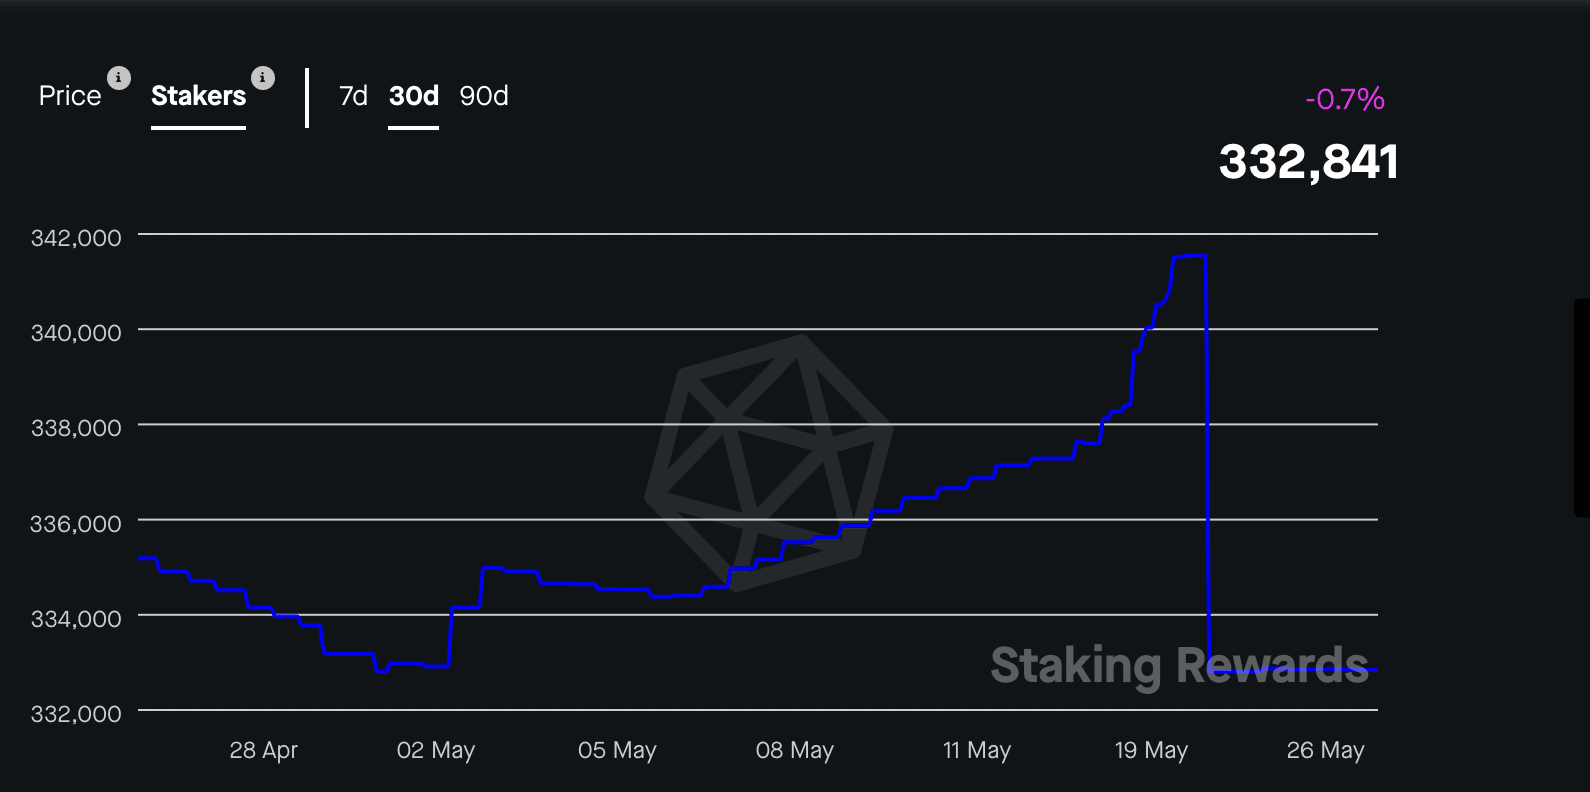
Despite TRX holders having much to celebrate around TRX’s price action, data from Staking Rewards presented a concerning picture. Over the last 30 days, the number of stakers did witness a gradual rise on the network. However, the number of stakers witnessed a sharp drop to stand at 332,841 from a high of 341,550 as of 23 May.