
With Bitcoin trading north of $64K and Ethereum above $2,300, the broader altcoin market rallied along with the market leaders and posted gains over the last 24 hours. Tron, Neo, and IOST all saw breakouts from their symmetrical triangles and projected even higher levels, before individual pullbacks.
Tron [TRX]
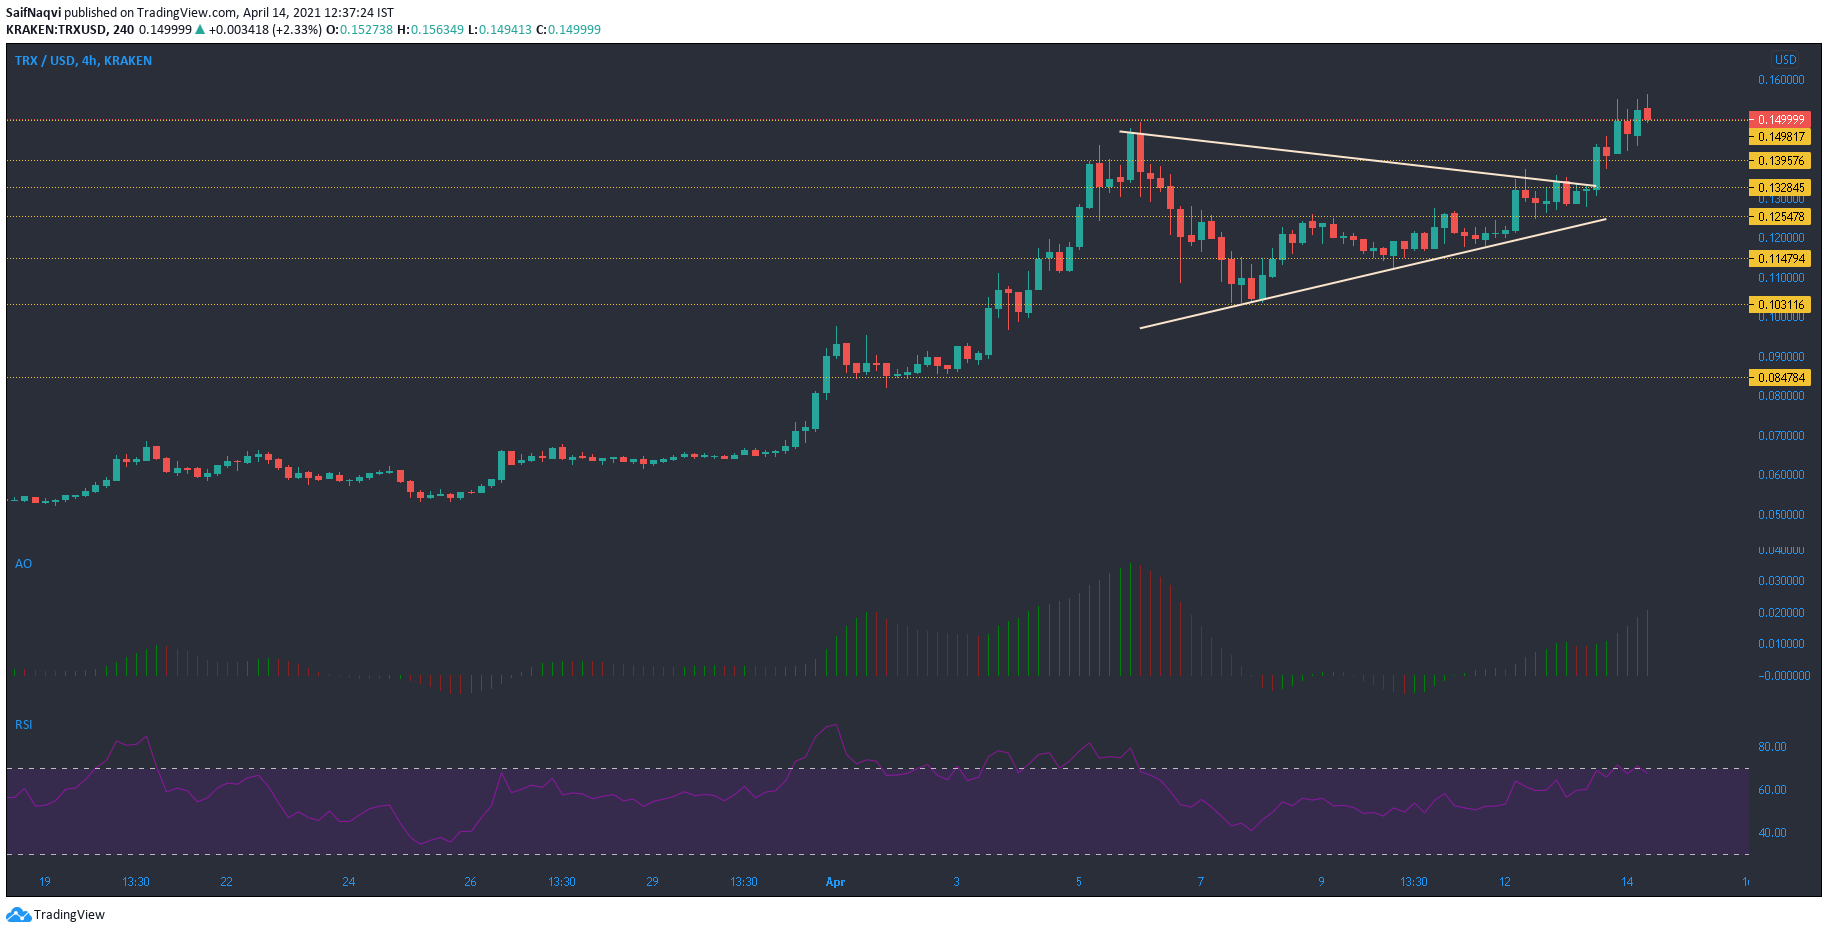
Source: TRX/USD, TradingView
Since a bounce back from the $0.103-level, Tron formed three lower highs and higher lows and moved within a symmetrical triangle on the 4-hour chart. A breakout from this pattern was pushing TRX to its new local peak of $0.156, with the price 48% off from its ATH. Trading volumes jumped by 76% and clocked in at $9.1 billion, which was almost a billion more than the world’s third-largest crypto – Binance Coin.
The Awesome Oscillator showed strong momentum on the bullish side as TRX maintained its upwards trajectory. However, the RSI showed a saturated market and suggested stabilization moving forward. With such bullish market conditions, a pullback may be delayed till the price snaps higher levels. In case of a southbound move, the first line of defense would lie at $0.149.
Neo [NEO]
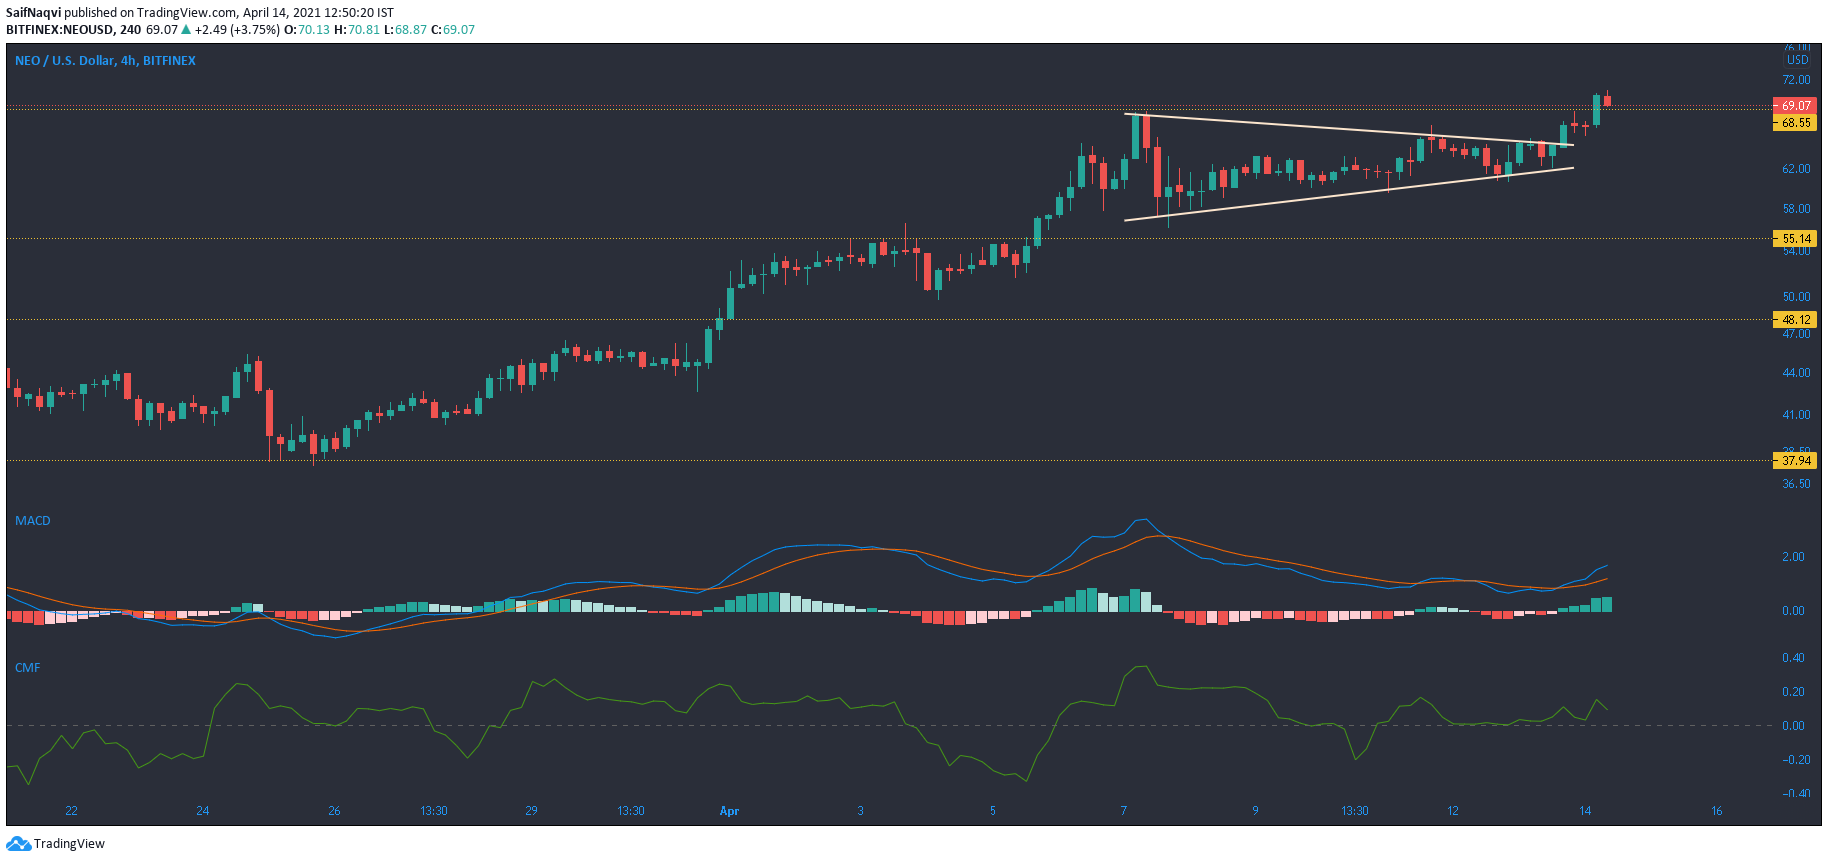
Source: NEO/USD, TradingView
After an accumulation phase was seen during most of March, Neo was on the move after a breakout above the $47.54-resistance. Since the onset of April, Neo has seen sharp northbound movement and a symmetrical triangle also appeared after the cryptocurrency touched the $68-mark. A breakout from this pattern pushed the price above $70 and more gains were likely in the coming sessions.
The MACD indicator reflected a bull market since the breakout, while the histogram noted rising momentum. Even though the Chaikin Money Flow was pointing south, at the time of writing, it was above the half-line and capital inflows remained healthy. In case of a minor dip, there lay some support above the $68-level.
IOST

Source: IOST/USD, TradingView
Since the late February pullback, IOST formed three lower peaks and supports at higher levels. Hence, another symmetrical triangle formed on the 4-hour chart and a breakout from the upper trendline to its peak represented gains of nearly 40%. A major resistance line of $0.066 was breached in this process and IOST was in price discovery mode, after having snapped a newer ATH at the time of writing.
The RSI forayed deep into the overbought zone and touched 85. While this generally indicates a pullback, the strong upcycle could push IOST towards the psychological level of $0.09 before a correction takes place.