Tron: TRX buyers must be wary of these levels before going long

Disclaimer: The findings of the following analysis are the sole opinions of the writer and should not be considered investment advice.
After taking off from the $0.06-support, Tron (TRX) made impressive progress on its chart. Higher lows alongside steady highs beyond the 38.2% and 50% Fibonacci level bagged in well-desired up-channel (white) gains.
With the 61.8% level reflecting a momentous stiffness, a likely drawdown could propel a patterned breakout in the four-hour timeframe. In this case, the $0.07-$0.08 range should cushion any potential bullish endeavors. At press time, TRX was trading at $0.0832, up by 6.12% in the last 24 hours.
TRX four-hour chart
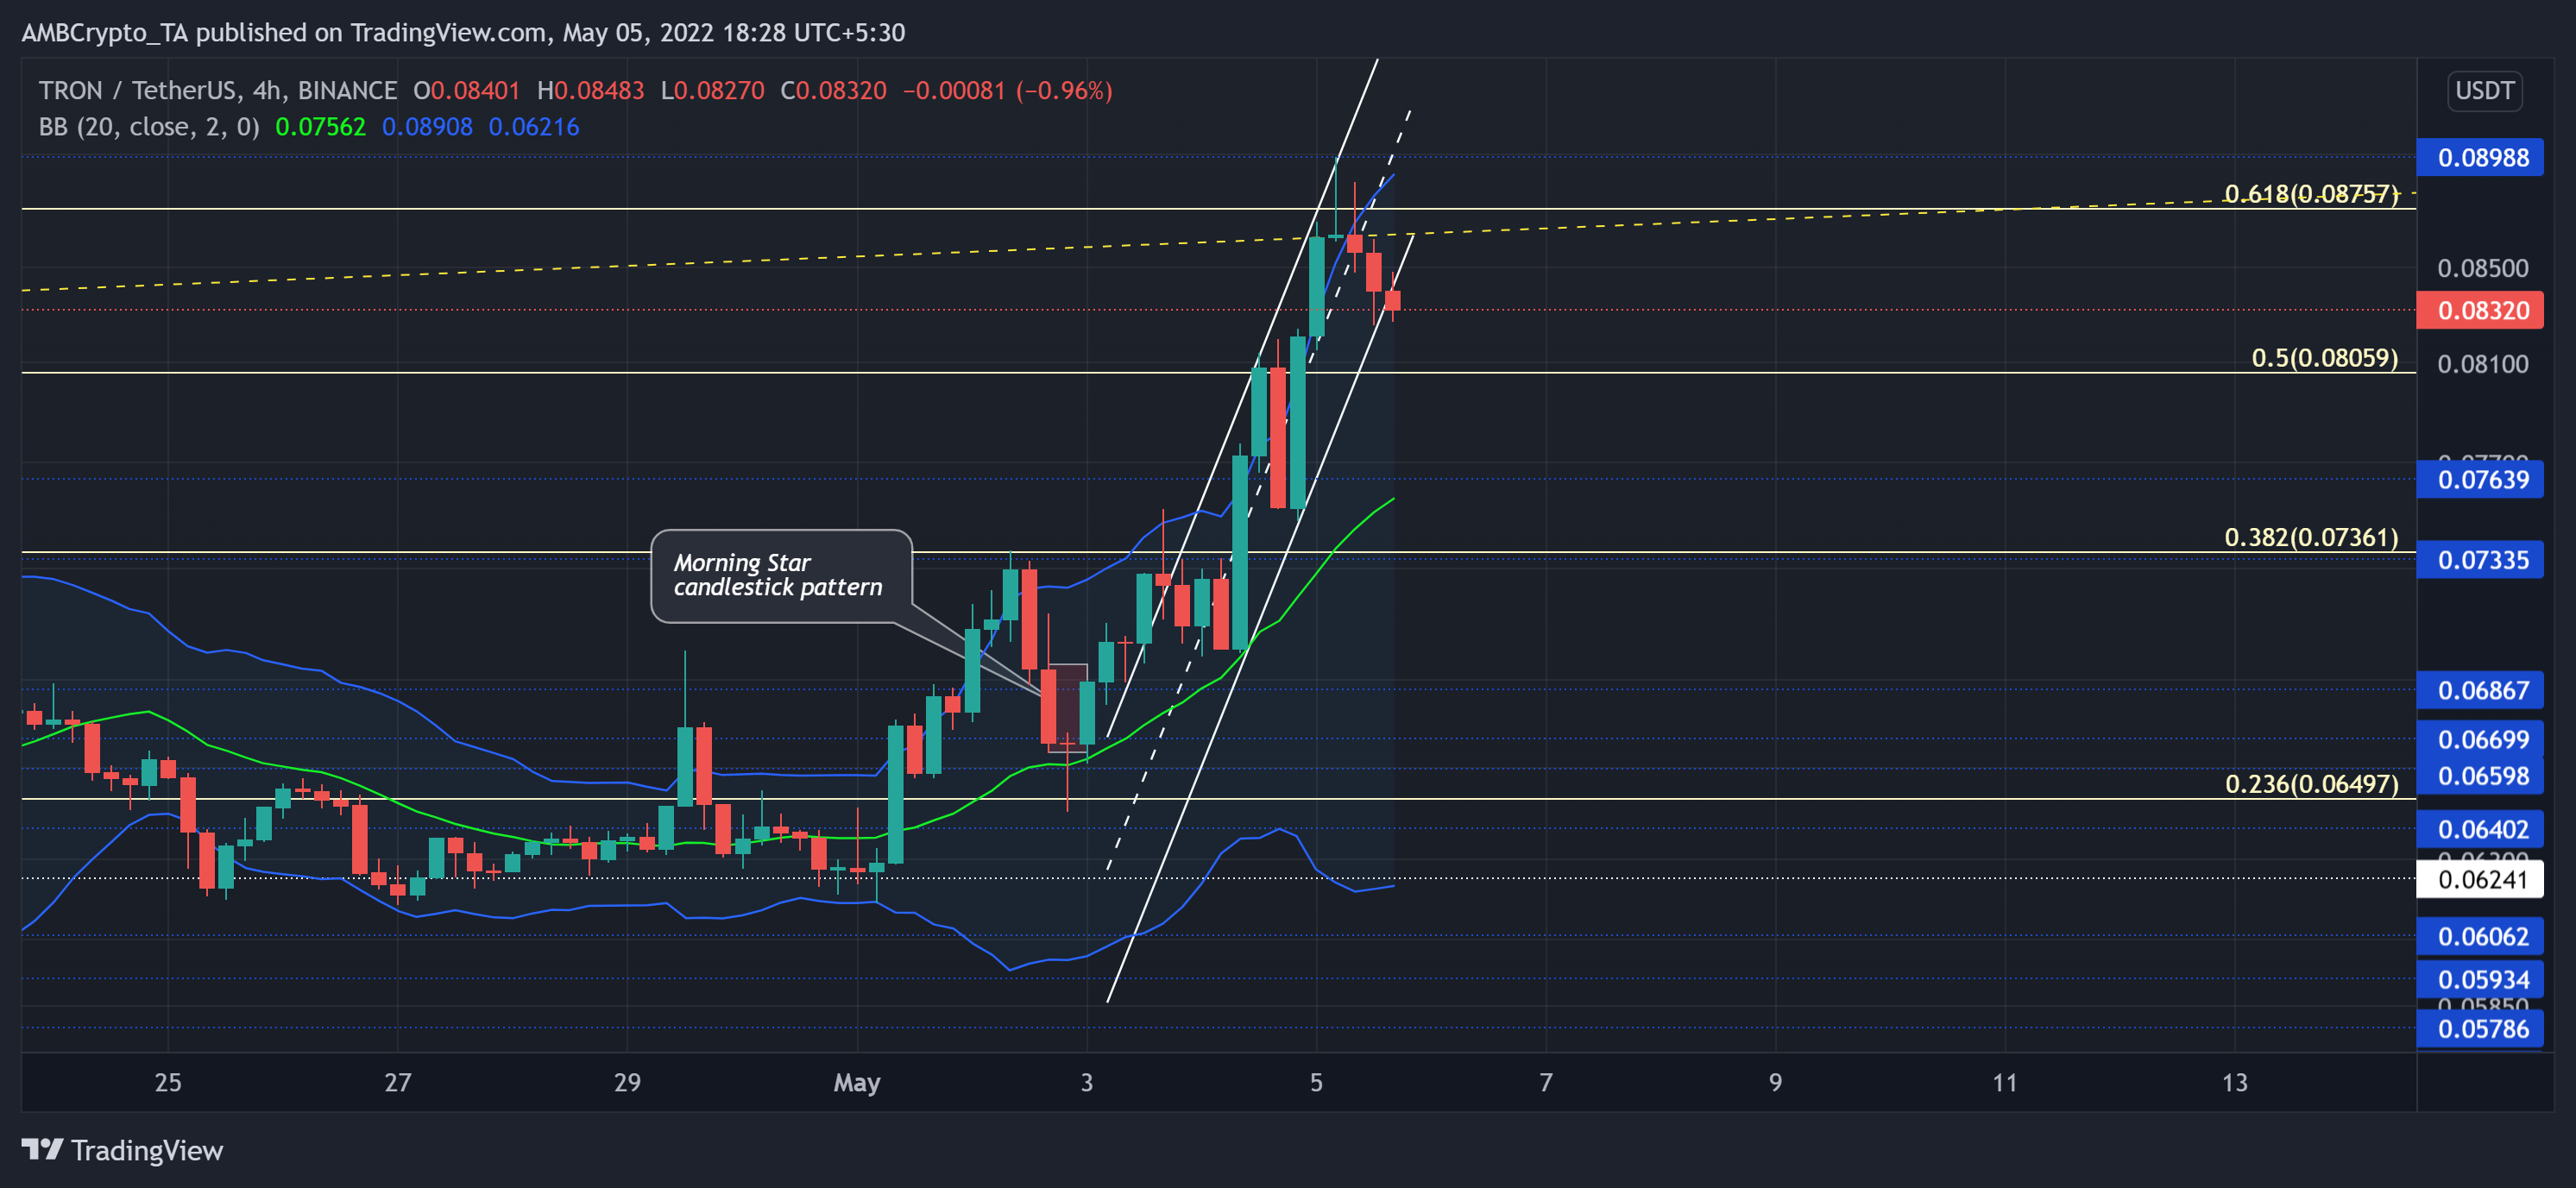
TRX’s ascending channel crystallized after the prices revived from a low of $0.064 on 2 May. The morning star candlestick setup catalyzed the buying build-up at the $0.066-level. Thus, driving a nearly 40% growth until TRX poked its five-month high on 5 May.
Then, as the price approached its multi-week trendline resistance (yellow, dashed), the alt quickly turned it back on it while breaking out the current pattern. To confirm a negative outcome for the buyers, TRX needs to convincingly close below the pattern. From there, the 50% Fibonacci level and the $0.076-support would be potential targets for the sellers.
Having a bird’s eye view of the broader trend, the buyers should not find it difficult to support the retracements at the basis line (green) of the Bollinger Bands (BB). Despite a potential fall from the upper band of the BB, the price could hover in the upper zone of the BB in the coming times.
Rationale

The alt’s technical indicators made it clear that buyers dominated the ongoing momentum. The RSI showed slowing signs after testing the overbought mark twice in the last 24 hours. A continued progression in its current direction could cause a short-term setback on TRX’s chart.
To top it up, the Aroon Up (yellow) ditched its upper ceiling and took a slight plunge. This trajectory hinted at gradual ease in the buying vigor. Further, the CMF seemingly approached the zero-mark. But a revival from its trendline support can affirm a hidden bullish divergence with the price action.
Conclusion
All in all, the momentum rested with the buyers. But with the confluence of the 61.8% Fibonacci resistance coupled with a reversal pattern, TRX could see a near-term pullback. In which case, the $0.07-zone would be vital for the buyers to swoop in and defend to prevent a bloodbath.
Besides, the investors/traders should consider Bitcoin’s movement and its impact on broader market perception to make a profitable move.