Tron [TRX]: Is deep retracement a sign of bullish exhaustion?
Tron was enjoying the highs of its latest bullish strides until it was met with a critical roadblock at the $0.0850 - $0.0940 price level. Will the bulls move forward or will the bears seize control from now on?

Disclaimer: The information presented does not constitute financial, investment, trading, or other types of advice and is solely the writer’s opinion.
- TRX suffered crucial retracement at a key price level.
- The futures market reacted negatively to retracement with a sharp drop in Open Interest.
Bitcoin’s [BTC] bearish outlook has reverberated across the crypto market. Despite Tron’s [TRX] upward trend, the market’s bearish outlook caught up with the altcoin on its advance to a critical price level.
Read Tron’s [TRX] Price Prediction 2023-24
Tron experienced a significant retracement on its retest of the 2022 high of $0.0944 on 22 July. This highlighted the selling pressure still present at the price zone. With the retracement taking TRX toward a critical support level, will bears extend the selling pressure, or can bulls mount a fight back?
Has Tron’s bullish streak ended?
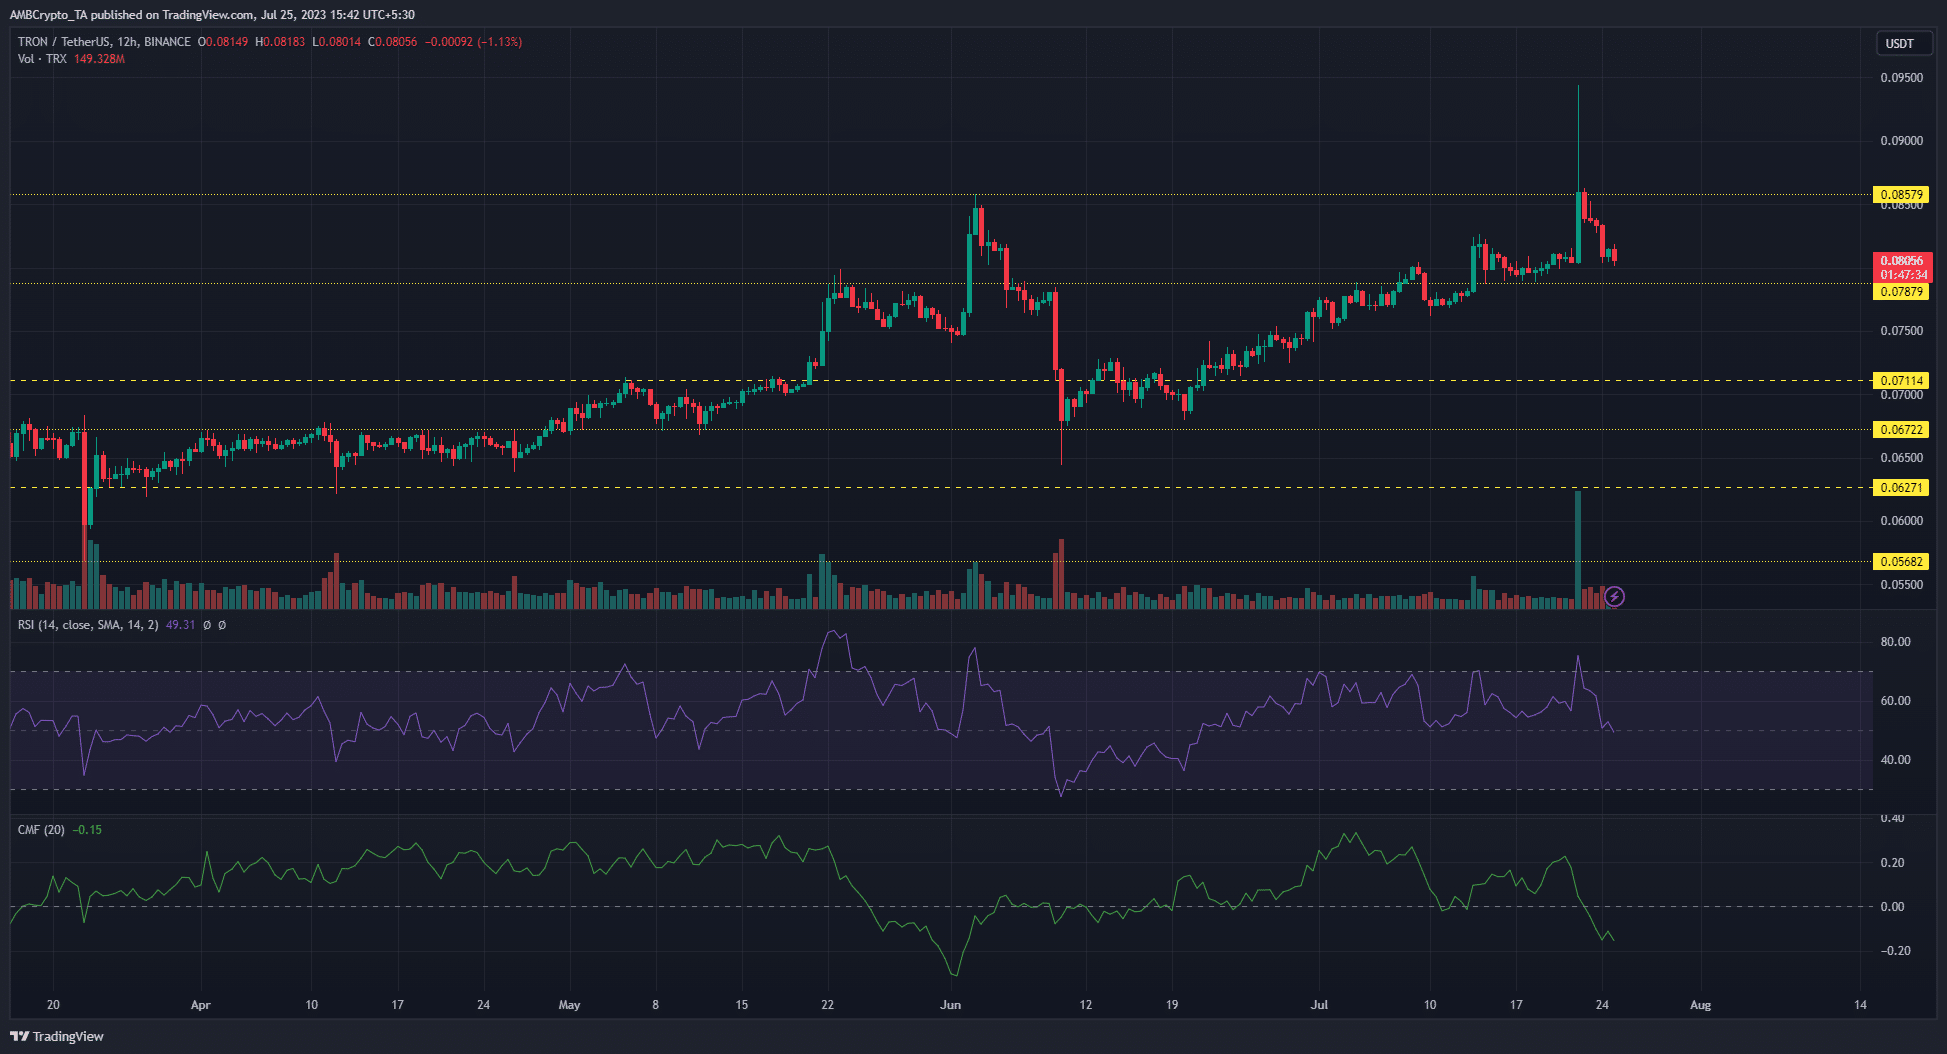
A look at TRX’s price chart on the 12-hour timeframe highlighted its recent bullish trend. Tron made a series of higher lows, flipping the $0.0711 and $0.0787 resistance levels to support.
However, the bullish trend hit a critical roadblock at the $0.0850 – $0.0940 price level. A 15% price drop between 22 July to 24 July saw Tron hovering just above a key support level, as of press time.
With the price lying at a critical level, a break below the $0.0787 support level will see bears break a confluence of support levels and a higher low. Take profit levels would lie at $0.0700 – $0.0711. This could flip TRX bearish on the higher timeframes. On the flip side, a successful defense at the support level by the bulls would sustain the uptrend for TRX.
Meanwhile, the Relative Strength Index (RSI) dipped below the neutral-50 and the Chaikin Money Flow (CMF) entered negative territory, highlighting waning demand and strong capital outflows.
Decline in Open Interest showed weakening long positions
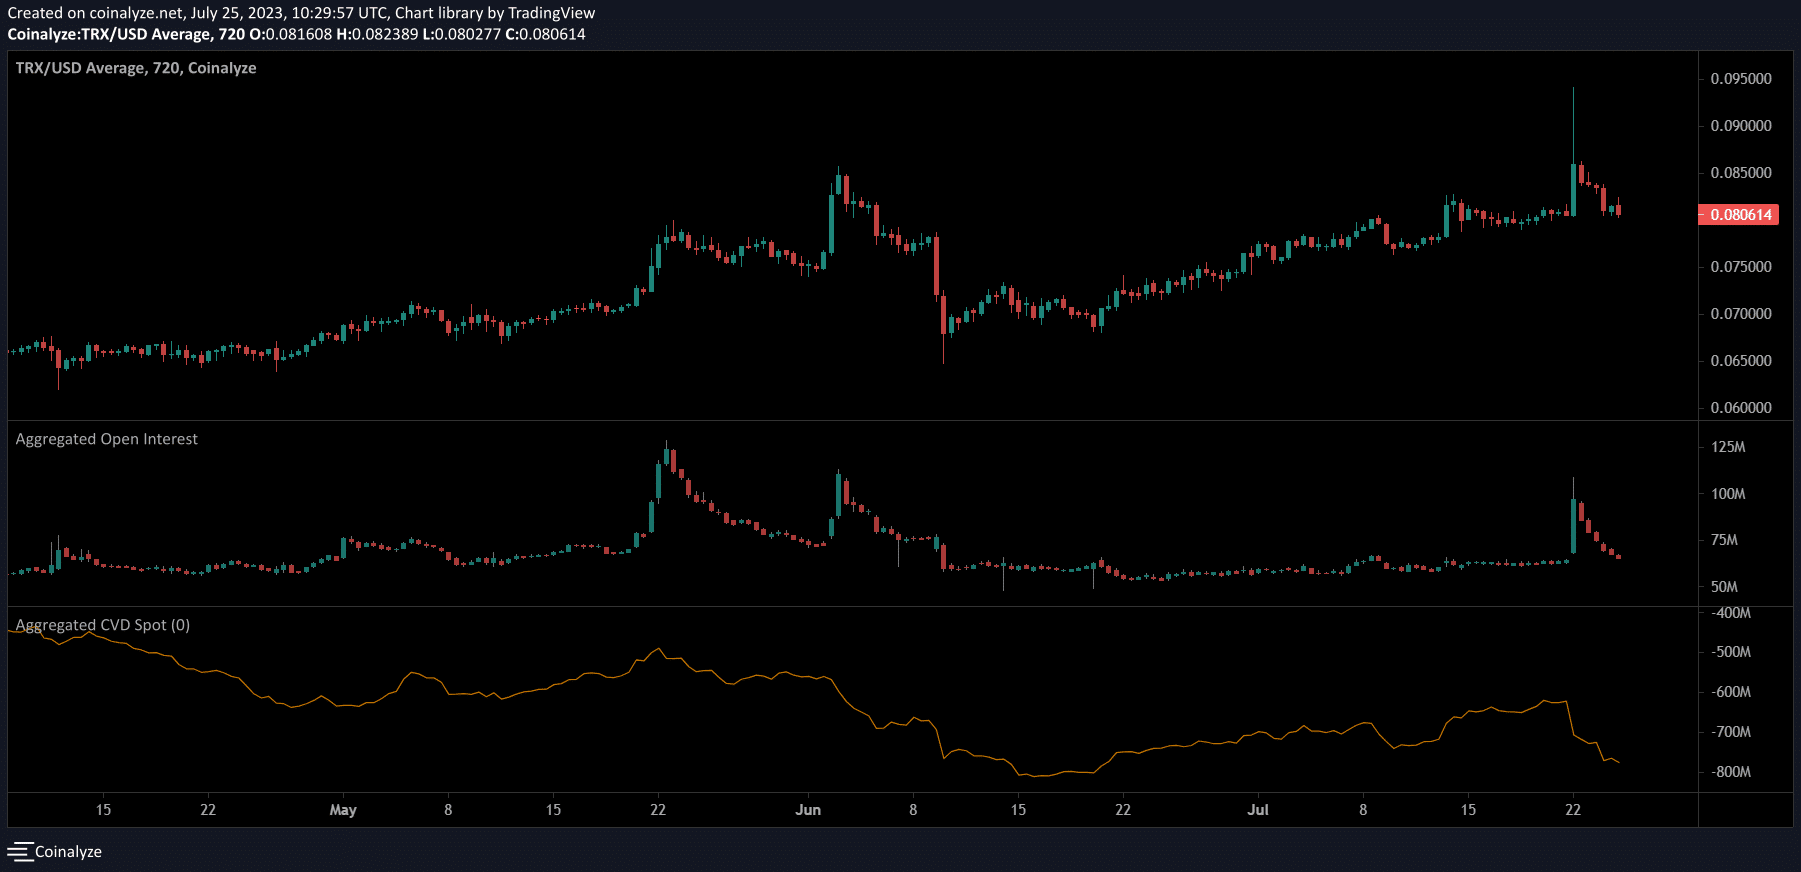
TRX’s price dip saw an attendant decline in its Open Interest (OI). Data from Coinalyze showed that the OI dropped from $95 million to $65 million over the past three days. This indicated liquidation by discouraged long traders which hinted at a continuation of the bearish trend for Tron.
How much are 1,10,100 TRXs worth today?
Similarly, the Spot CVD dropped sharply highlighting the waning demand. This could serve as a cue for more bearish momentum in the short term.