Tron [TRX]: Why an extended rally depends on these conditions

Post a lift-off from the $0.066-support, Tron [TRX] has made an impressive advancement in the last three weeks. After matching its monthly highs on 1 June, the lower peaks coupled with higher troughs chalked out a symmetrical triangle.
Should the current revival streak sustainably close above the stiffness of the Point of Control (POC, red), TRX could retest the $0.084-zone. At press time, TRX was trading at 0.08166, up by 0.85% in the last 24 hours.
TRX 4-hour Chart

Unlike most of its peers, TRX has disregarded the market-wide sentiment while registering newer peaks over the past two months. The bounce-back from the $0.062-support laid a foundation for consistent buying rallies. Thus, driving a nearly 47% growth until TRX poked its monthly high on 1 June.
The reversal from the $0.089-level rebounded from the 61.8% Fibonacci support as TRX confirmed a symmetrical triangle.
To confirm a bullish outcome, TRX needs to convincingly close above the basis line (green) of the Bollinger Bands (BB). From there, the 23.6% Fibonacci level and upper band of the BB would be potential targets for the sellers.
But unless the buying volumes see a substantial uptick, the alt could likely continue to squeeze near its POC. While the price still hovered above the 200 EMA (red), the buyers assumed control of the long-term trend.
Rationale
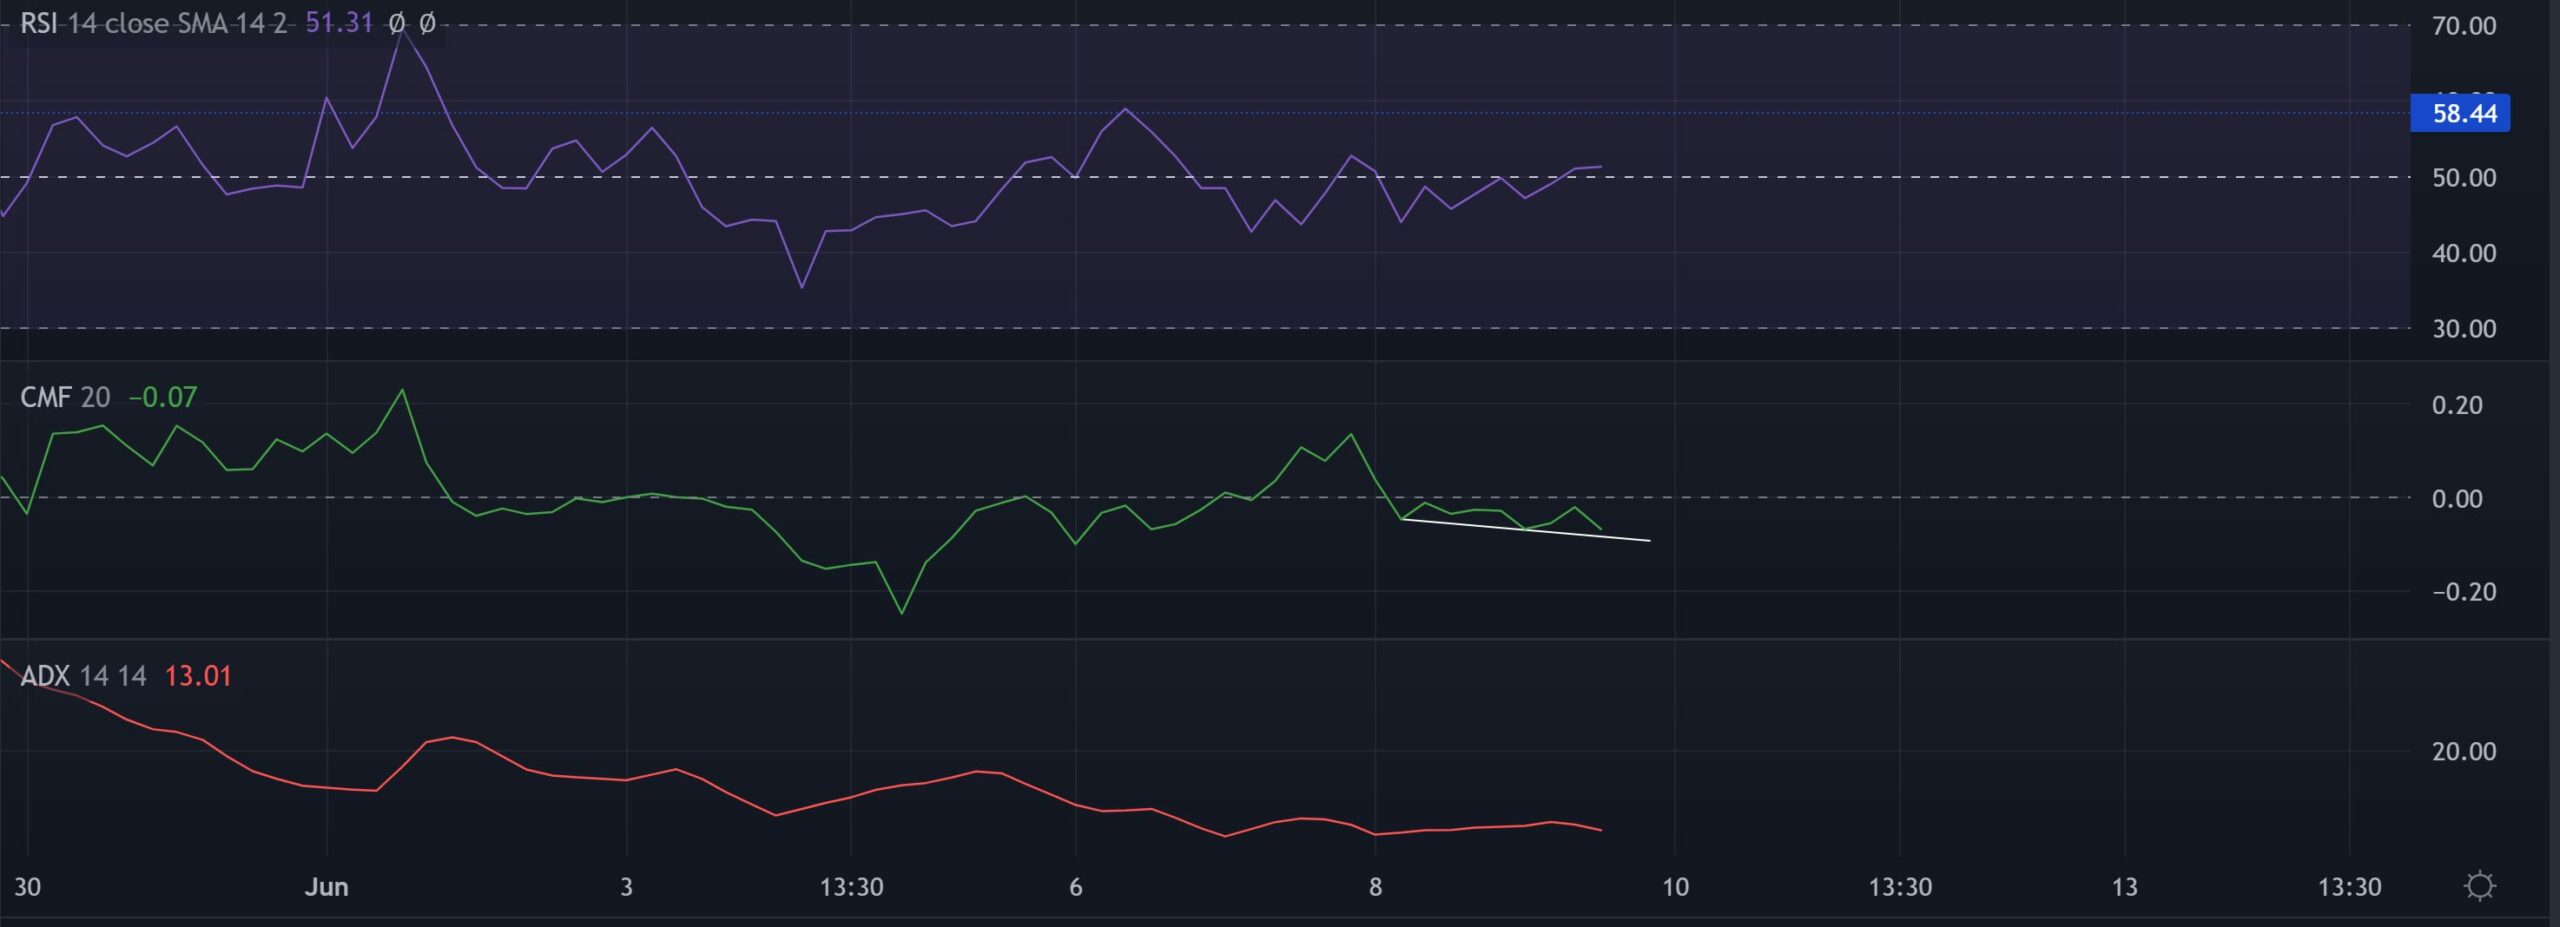
The alt’s technical indicators took a relatively neutral stance in the current market dynamics. The RSI showed tightening signs after moving around the midline for the last few days.
Further, the CMF took a plunge below the zero-mark. But a revival from its trendline support can affirm a hidden bullish divergence with the price action. Besides, the ADX depicted a very weak directional trend for TRX.
Conclusion
All in all, the indicators exhibited neutrality. But with the 38.2% Fibonacci support alongside the break above the symmetrical triangle, TRX could see a near-term revival. In which case, the $0.084-zone could slow down the buying efforts.
The lack of buying vigor currently could extend the squeeze phase in the coming sessions. Finally, the investors/traders should consider Bitcoin’s movement and its impact on broader market perception to make a profitable move.


