Uniswap, Tezos, Sushi Price Analysis: 26 January

With Bitcoin jumping above its 4-hour 20-SMA, Uniswap improved its market position from the oversold region. But it strived to test the $10 supply zone. Furthermore, Tezos and Sushi also climbed above their 20-SMA.
Uniswap (UNI)
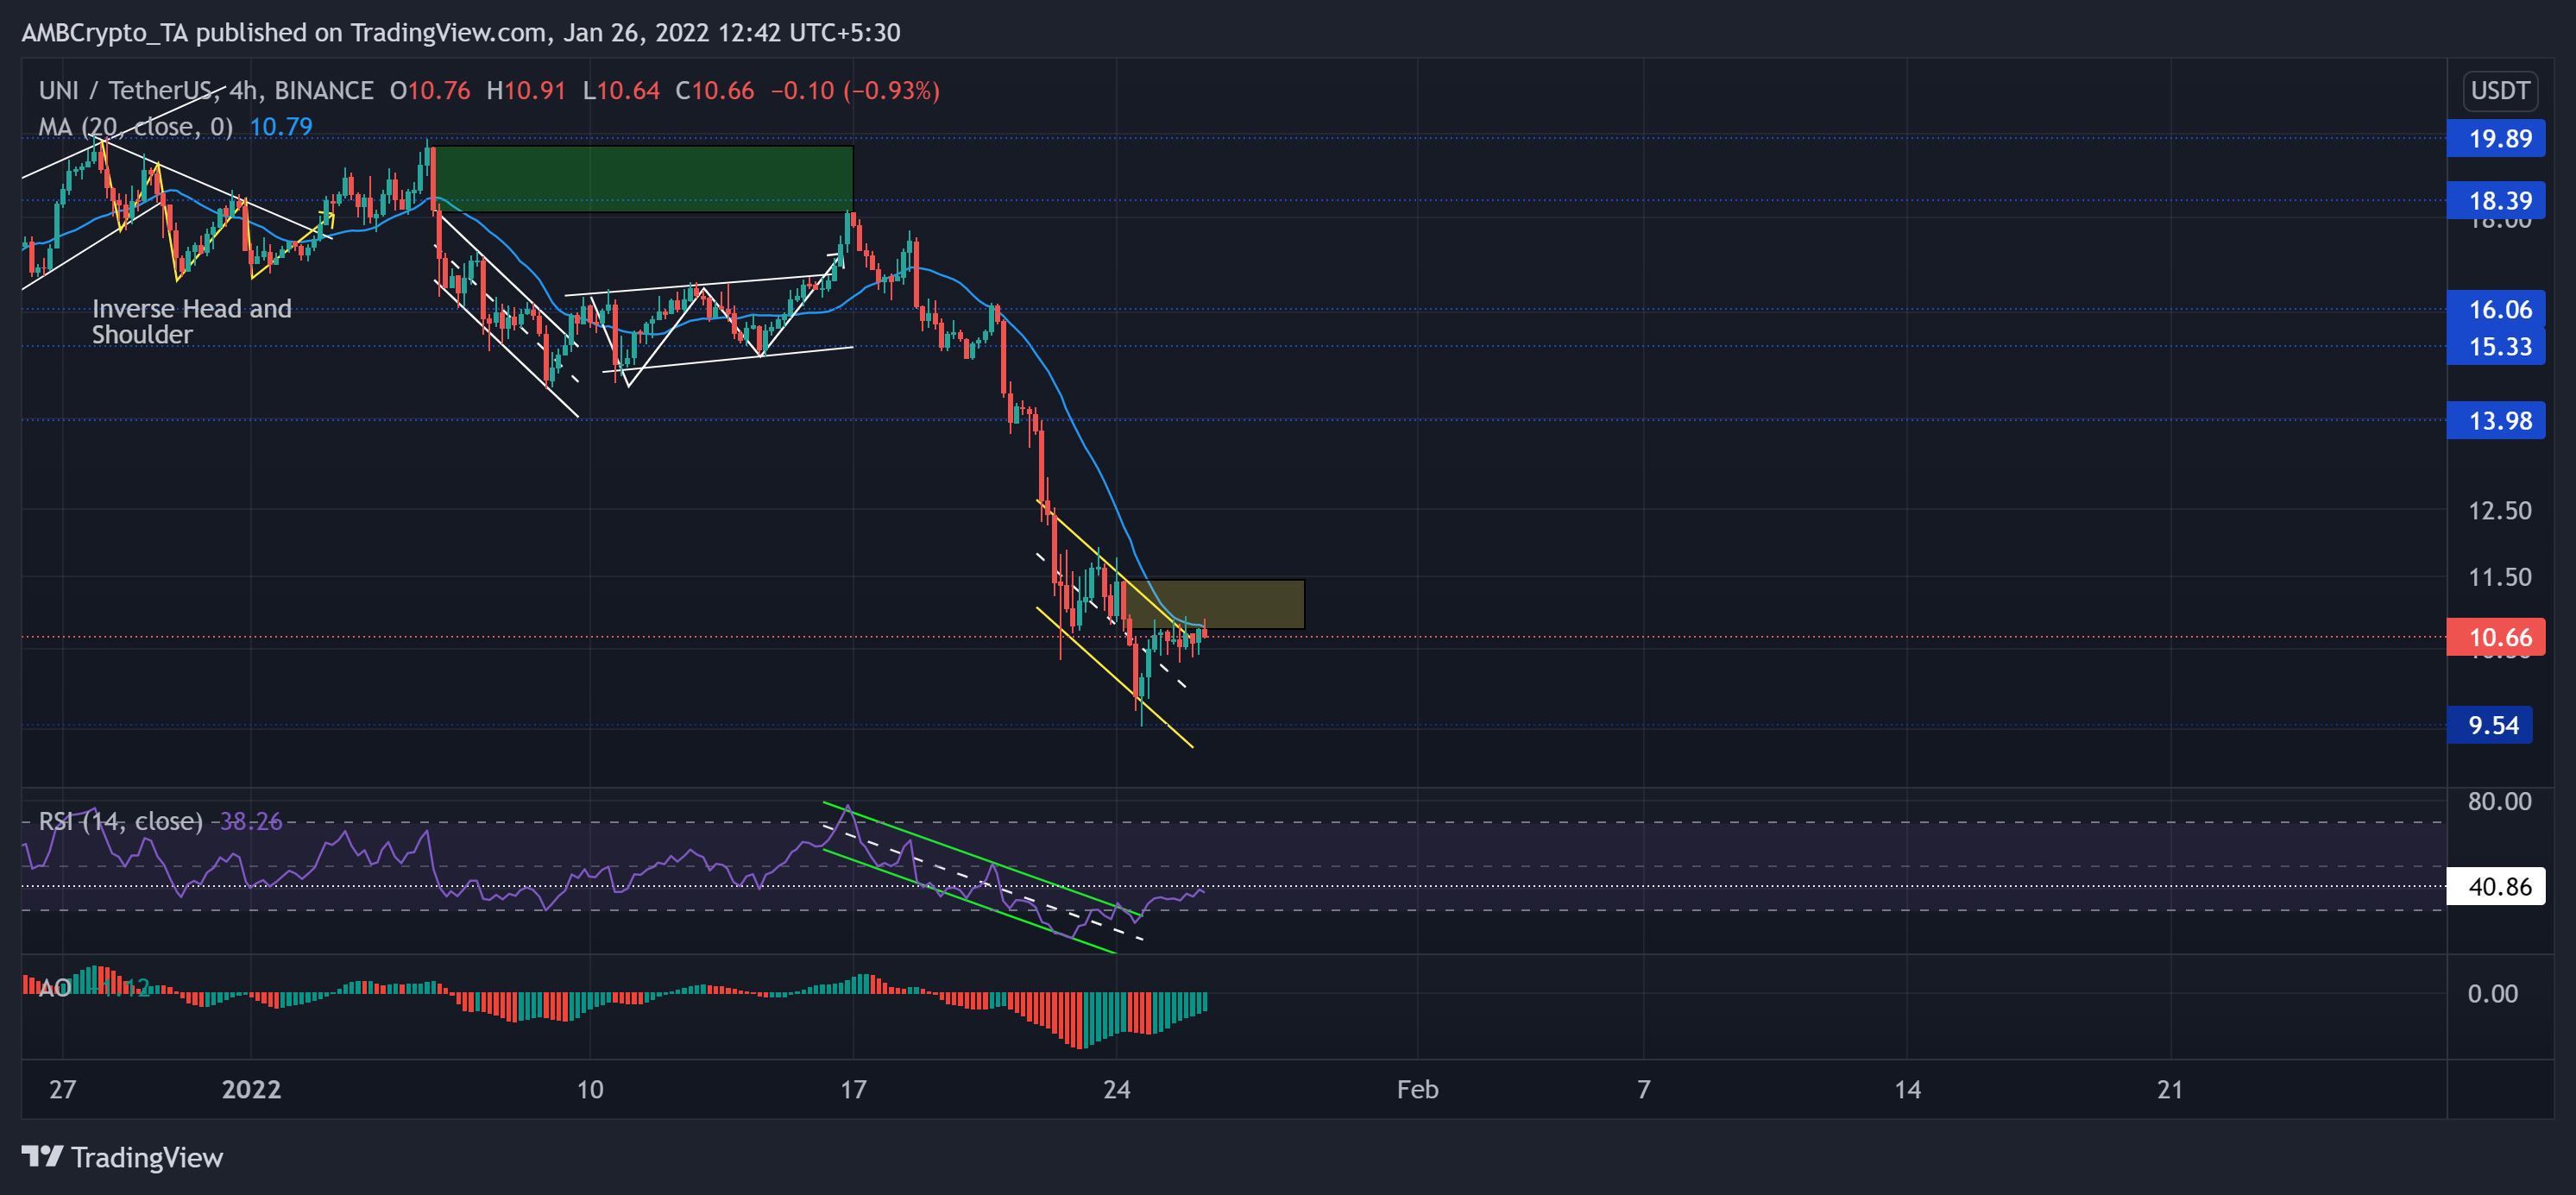
The inverse head and shoulder breakout halted at the $19.89-mark two-month resistance. Since then, the alt has been on a steady decline. The two substantial sell-offs marked bearish engulfing candlesticks that propelled a 51.24% fall. As a result, UNI poked its one-year low on 24 January.
Over the past few days, it saw a down-channel (yellow) on its 4-hour chart. After a 15% 2-day revival, UNI broke out of the pattern but reversed from the $10 supply zone (yellow, rectangle). Now, immediate resistance stood at the 20-SMA (cyan) that coincided with the supply zone.
At press time, the alt traded at $10.66. the RSI rapidly plunged in a down-channel from the 77-mark. Over the past two days, it broke out of the channel but still needed to close above 40 to confirm a strong revival. Further, the AO continued to depict decreasing selling influence.
Tezos (XTZ)
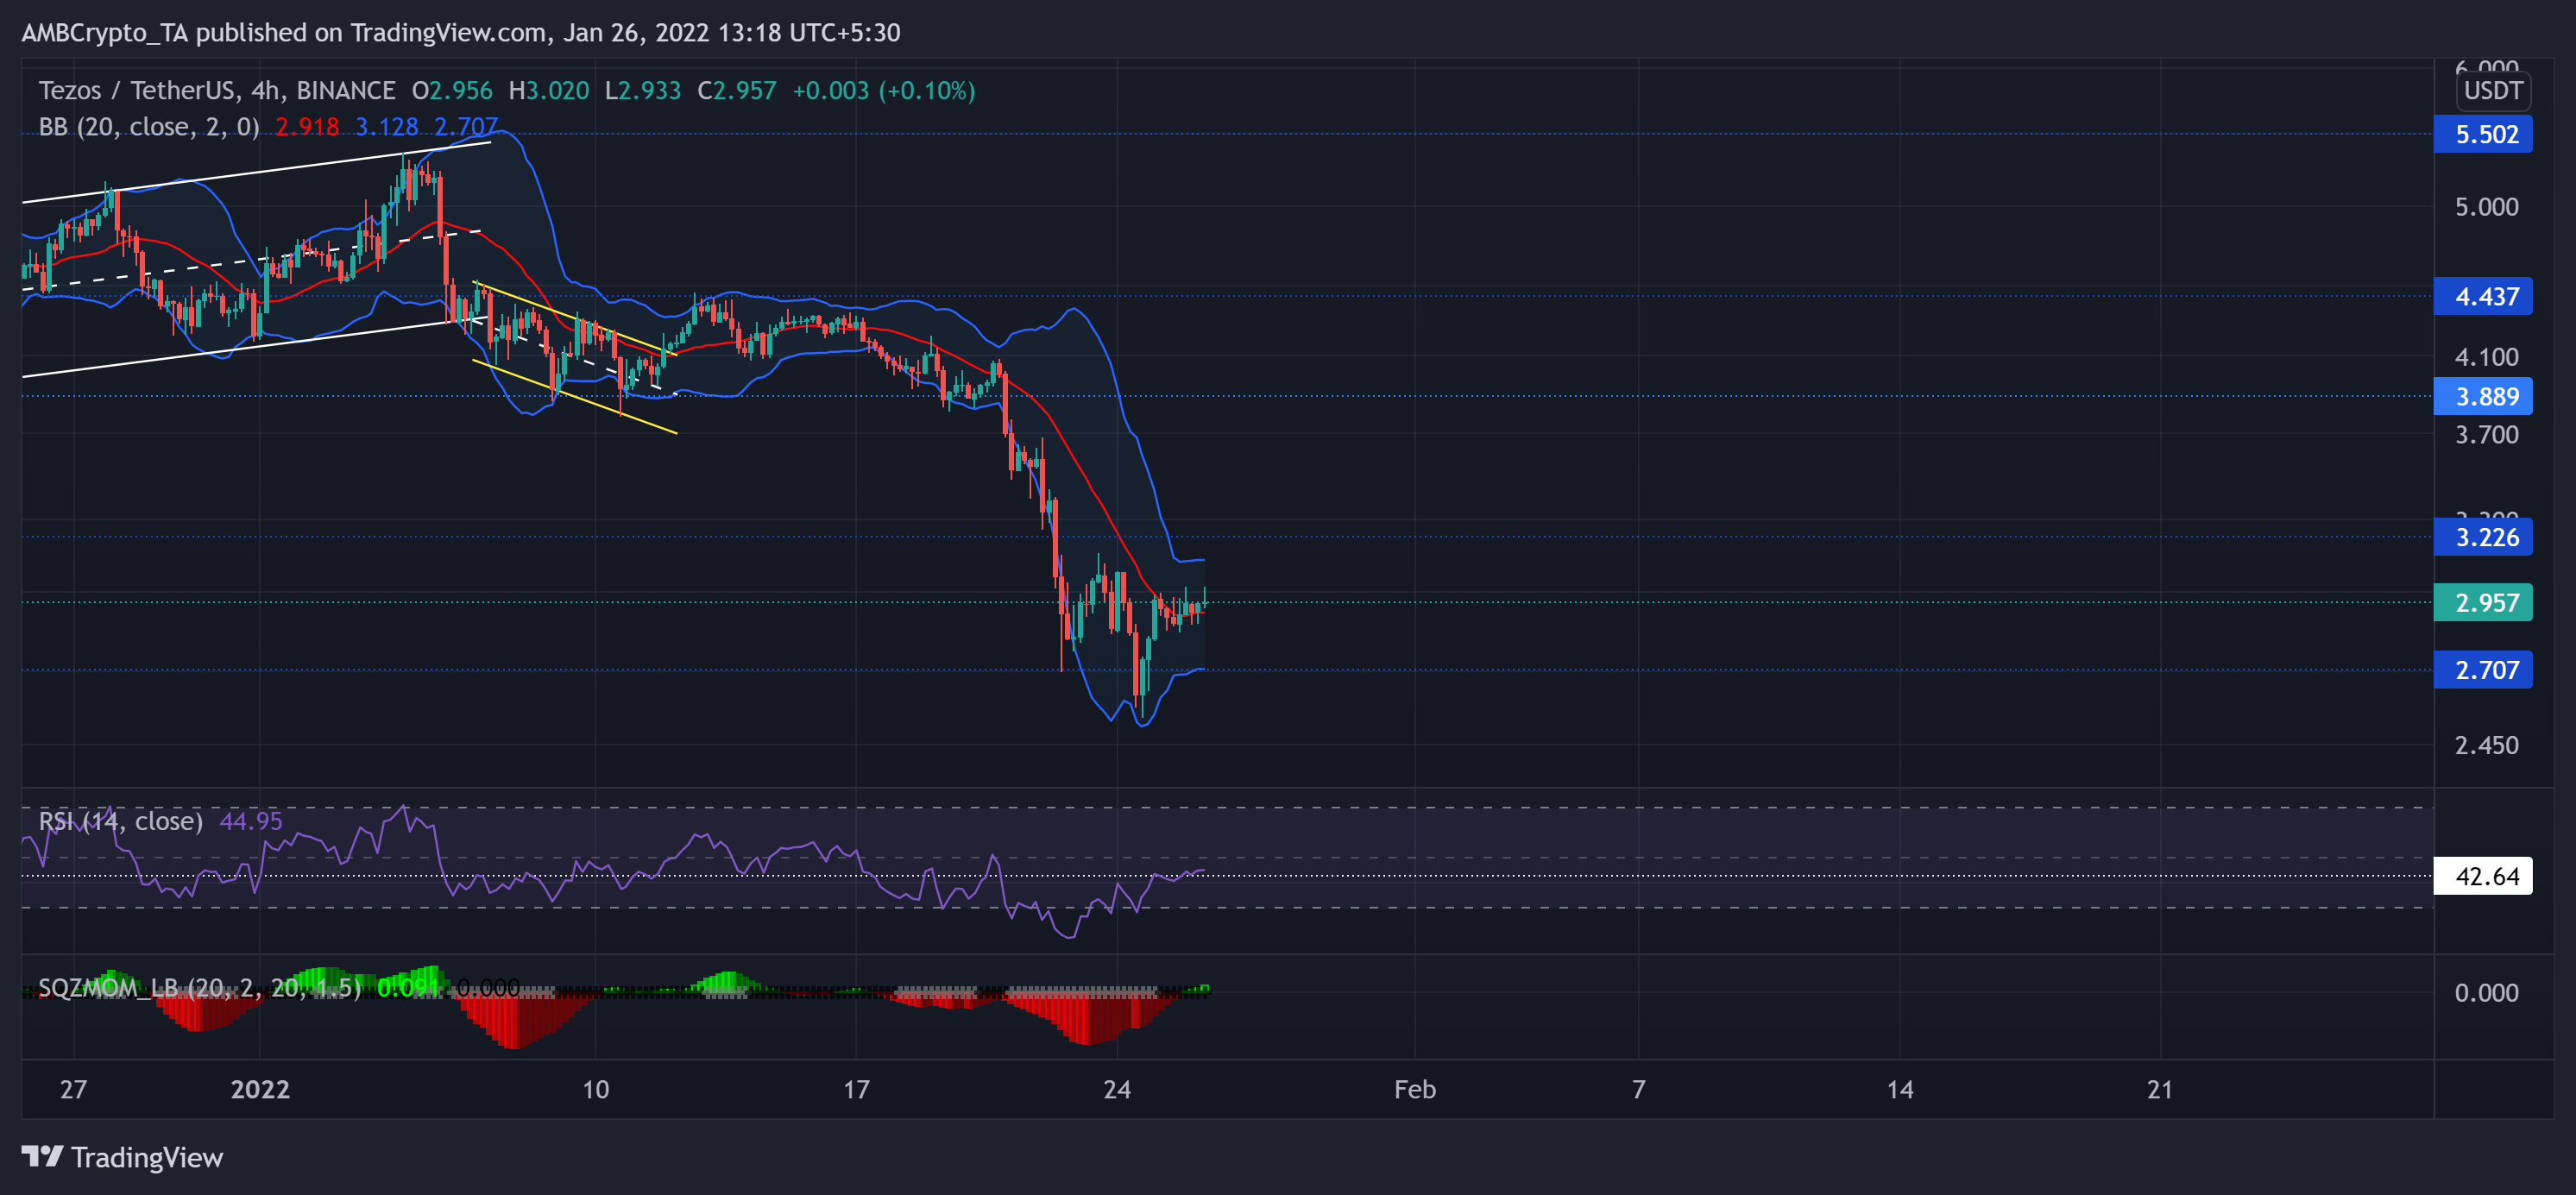
The 21 January sell-off gave thrust to bulls as they finally breached the $3.8-mark five-month resistance (previous support). XTZ registered a 37.9% decline (from 20 January) as it marched toward its six-month low on 24 January.
As the buyers stepped in at the $2.7-level, the alt grew by nearly 18% from the lower band of the Bollinger bands. As a result, it crossed the basis line (red) while hinting at the decreasing selling power. Now, an immediate barrier for the bulls rested at the upper band of BB.
At press time, XTZ traded at $2.957. After hitting its record low on 22 January, the RSI saw an impressive revival over the past four days. It crossed the 42-mark level and oscillated sideways. Also, the Squeeze Momentum Indicator saw black dots, hinting at low volatility in the near term.
SUSHI
SUSHI saw a staggering 110% rally (from 20 December low) that touched its six-week high on 30 December. Since then, it retreated in down-channel (white) on its 4-hour chart and flipped the 20-SMA (red) from its support to resistance.
SUSHI marked a nearly 64.62% retracement (from 30 December) as it plunged toward its one-year low on 24 January. The alt also lost the 61.8% Fibonacci level after testing it multiple times. Now, the testing point for the bulls stood at the $4.6-level.
At press time, SUSHI traded at $4.403. The RSI was in an uptrend but still struggled to cross the half-line. Also, the recent pullback volumes have exceeded the incline volumes. This reading hinted at a slight bearish edge.


