
With monthly losses of over 25%, Uniswap seems to struggle to cope up with the broader market selling pressure. What’s more, is that its troubles seem to extend far beyond its price and have seeped into its network activity as well. However, recovery over the past few days did see UNI climb above its 20-SMA (yellow) and there were chances of a potential trend shift moving forward. At the time of writing, Uniswap traded at $17, up by 6.5% over the last 24 hours.
Uniswap 4-hour chart
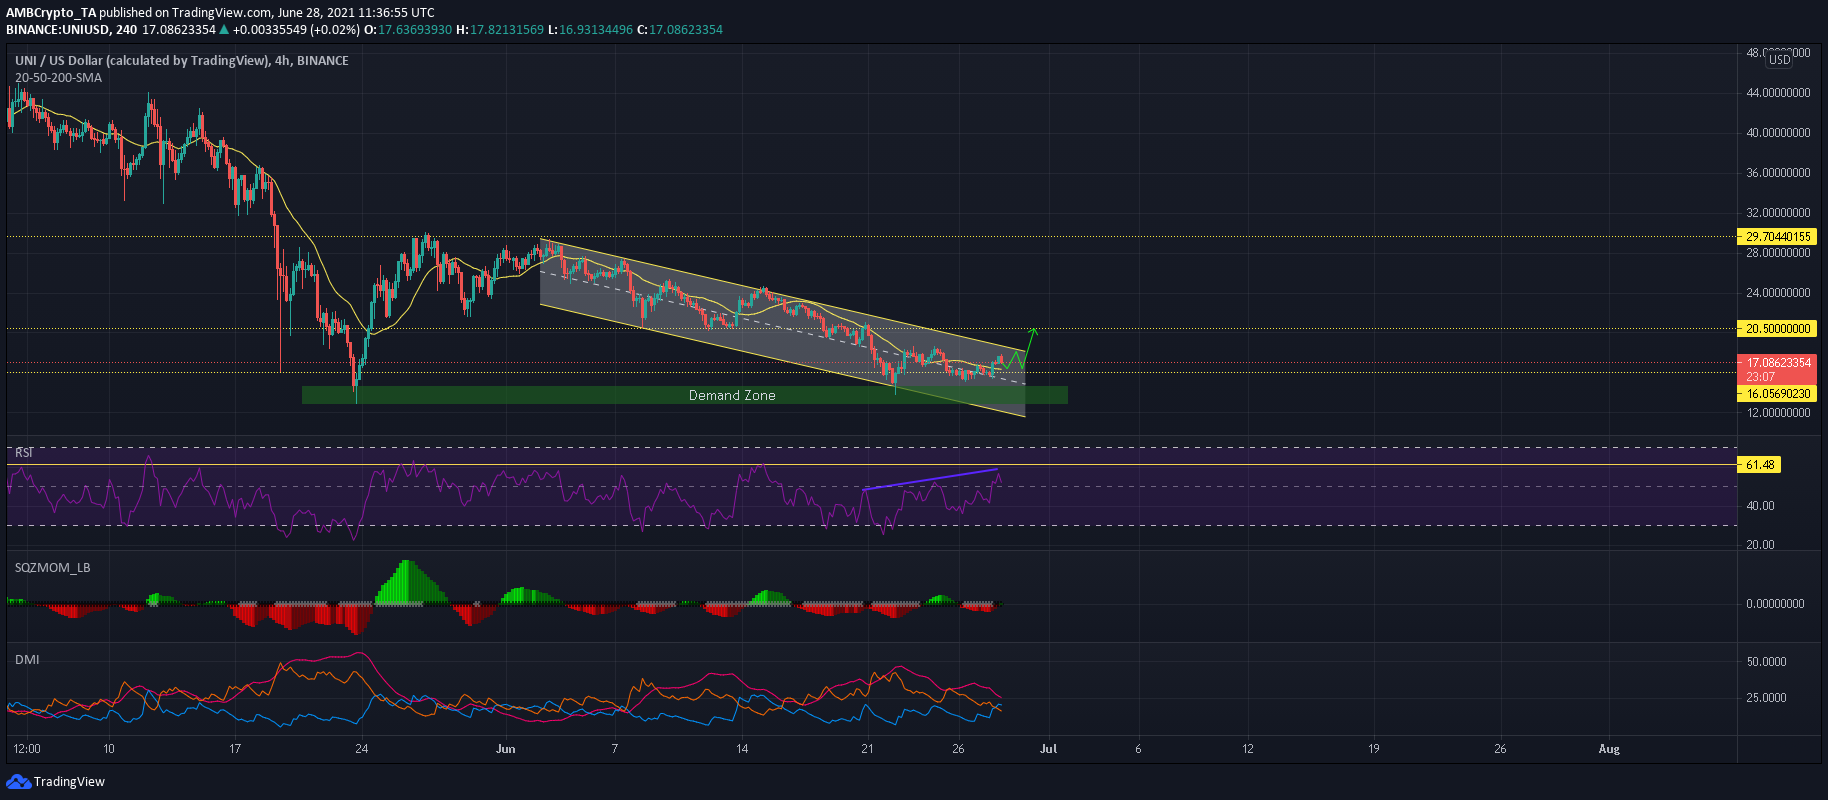
Source: UNI/USD, TradingView
DOT’s chart highlighted the formation of a down-channel once prices failed to rise north of the $29.5-mark. The channel has now lasted for a period of 25 days but a breakout has not been initiated by either side. However, the indicators did point towards the possibility of a favorable outcome over the coming sessions.
Reasoning
Relative Strength Index reset in the oversold zone over a week ago and has formed higher highs since. The index also formed a bullish divergence with regards to UNI’s price action. A rise above 55 would denote upwards pressure but there was some resistance slightly above 60. If this resistance mark is cleared, UNI can be expected to establish its next leg upwards. Such an outcome could boost prices towards the $20.5-mark- an area that clashed with the daily 20-SMA.
The Directional Movement Index noted a bullish crossover between the +DI line and -DI line as market control shifted towards the buyers. Moreover, bearish momentum was receding on the Momentum Squeeze Indicator and the first green bar followed by a white dot would present buy signals. A safe entry can be placed along the 4-hour 20-SMA around $16.43 and buyers can exit their position at a resistance line of $20.5.
Levels to watch out for
Entry: $16.4
Take-profit: $20.5
Stop-loss: $14.2
Risk/Reward: 1.83x
Conclusion
DOT’s indicators suggested that the market dynamics were shifting towards the bullish side and a down-channel breakout might occur over the coming sessions. This would present traders with an opportunity to bag some gains before sellers return to the market. A stop-loss has been placed slightly below the upper range of UNI’s demand zone of $13.14.6, while take-profit was placed at a resistance mark of $20.5.