Uniswap’s [UNI] network activity soars, but is it all just smoke and mirrors?
Uniswap's network activity rallies to new highs, while its trading volume and transaction fees take a beating.
![Uniswap's [UNI] network activity soars, but is it all just smoke and mirrors?](https://ambcrypto.com/wp-content/uploads/2023/05/AMBCrypto_An_image_of_a_rocket_launching_into_space_with_the_Un_9d032093-91de-4cb2-9e25-bc2fc6468f88.jpg)
- Uniswap’s daily active address and new wallet count reached fresh heights.
- UNI’s Chaikin Money Flow suggested that now might be a good time to buy.
The count of daily active addresses on Uniswap [UNI] climbed to a two-year high due to the unprecedented rally in the value of meme tokens in the past few weeks, Delphi Digital found in a new report.
Realistic or not, here’s UNI’s market cap in BTC terms
According to the on-chain data provider, “daily active addresses on Uniswap are spiking to levels not seen since May 2021.”
As of 9 May, the decentralized exchange (DEX) logged a count of 25,409 active addresses. Uniswap’s daily active addresses have risen consistently since the year began, fueled by the general market bullish run in Q1 and the meme coin frenzy of the past few weeks.

Additionally, Delphi Digital found that the number of unique wallets on Uniswap rallied to its highest level in almost two years, with nearly 80,000 users recorded. This surge marked a significant increase in the count of unique wallets created on the DEX since May 2021.
Much ado about nothing?
While Uniswap’s network activity has grown considerably well in the last year, data from Token Terminal revealed a decline in some of the DEX’s key ecosystem metrics. For example, with $519.30 billion recorded in trading volume in the last year, this represented a 38.30% drop.
A natural consequence of the decline in Uniswap’s trading volume was a drop in its fees. Per data from Token Terminal, the protocol’s annualized fees also fell by 22.05%.

Further, data from DefiLlama also revealed that Uniswap’s total value locked (TVL) trended downwards in the last year.
At $3.92 billion, the DEX’s TVL has since decreased by 24%. In addition, Uniswap V3, the protocol’s most used deployment, saw its TVL also fall by 15% during the same period.
Good time to buy?
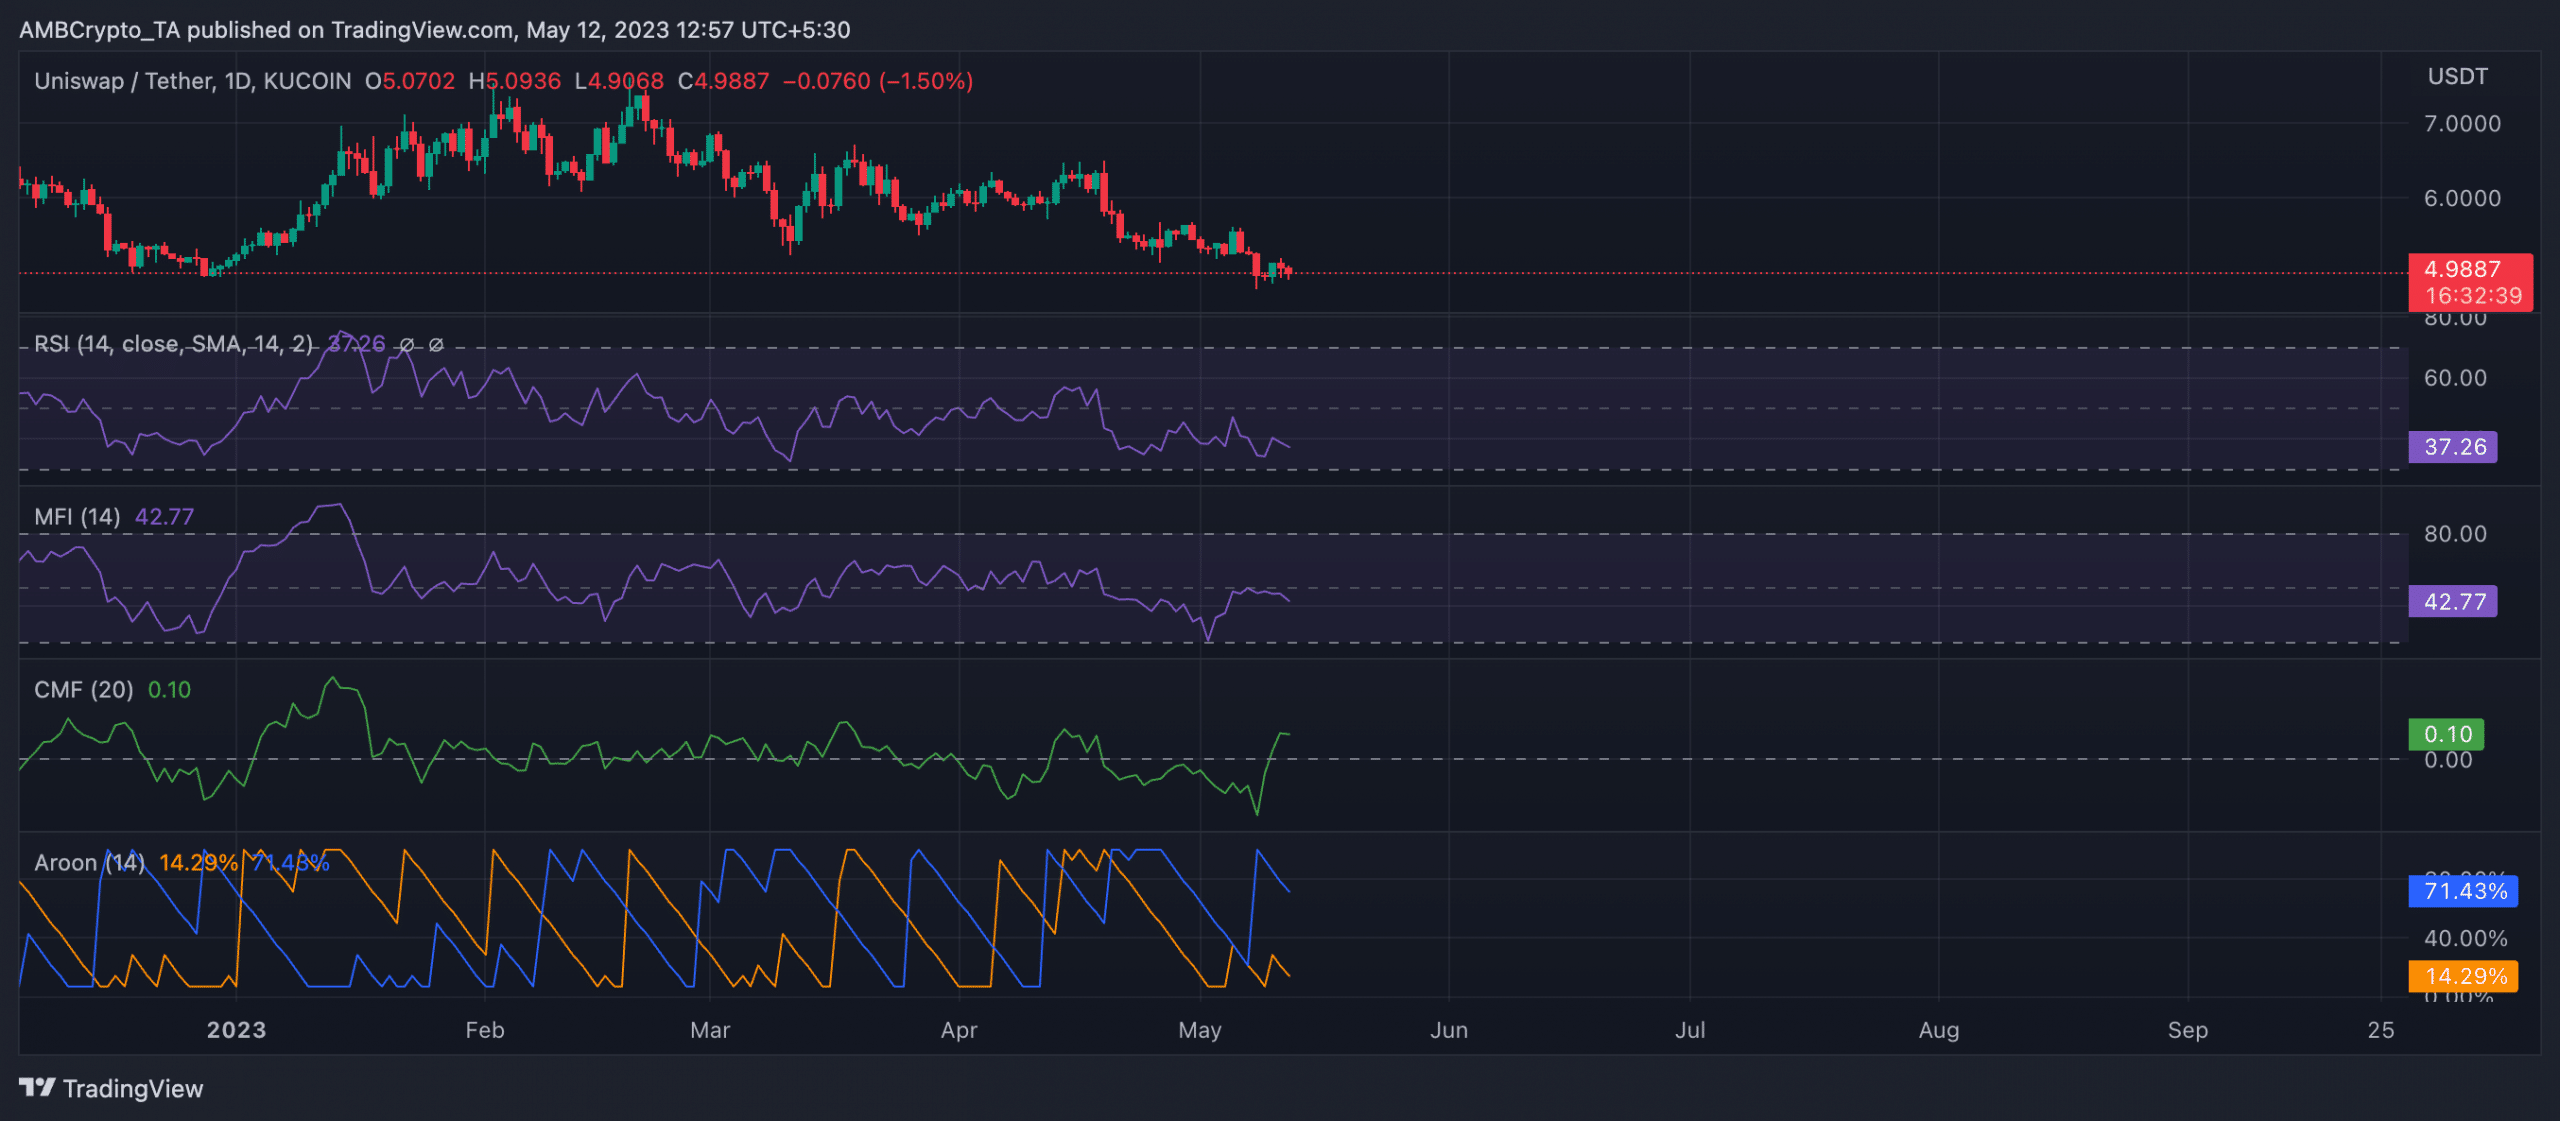
While UNI’s price trended downwards on a daily chart, its Chaikin Money Flow (CMF) remained in an uptrend at 0.10. This bullish divergence is common when the price of an asset falls to a new low, but its CMF moves in the opposite direction.
Therefore, it is often taken as a buy signal as it indicates that a price correction upward might be imminent.
However, it is key to point out that selling pressure outweighed buying momentum at press time. As a result, key momentum indicators were spotted below the respective neutral spots. Likewise, the Aroon Up Line (orange) was 14.29%.
Read Uniswap [UNI] Price Prediction 2023-24
When an asset’s Aroon Up line is close to zero, the uptrend is weak, and the most recent high was reached a long time ago.
Conversely, UNI’s Aroon Down Line (blue) was pegged at 71.43%. When the Aroon Down line is close to 100, it indicates that the downtrend is strong and that the most recent low was reached relatively not long ago.