VeChain climbs 28%, VeThor pumps 43% – But is a correction here?

- Both VET and VTHO’s social metrics increased last week.
- Technical indicators suggested a price correction for VTHO.
VeChain [VET] and VeThor [VTHO] have surprised investors in the recent past with their bullish performance.
As the market turned in investors’ favor, these tokens weren’t late to register promising upticks. Therefore, AMBCrypto planned to take a closer look at these tokens to find out what to expect from them.
VeChain and VeThor’s bull run
CoinMarketCap’s data revealed that VET’s price surged by more than 28% in the last seven days. Things for VTHO were better as the token witnessed over 43% price hike in a single day.
At the time of writing, these tokens were trading at $0.02546 and $0.002527, respectively.
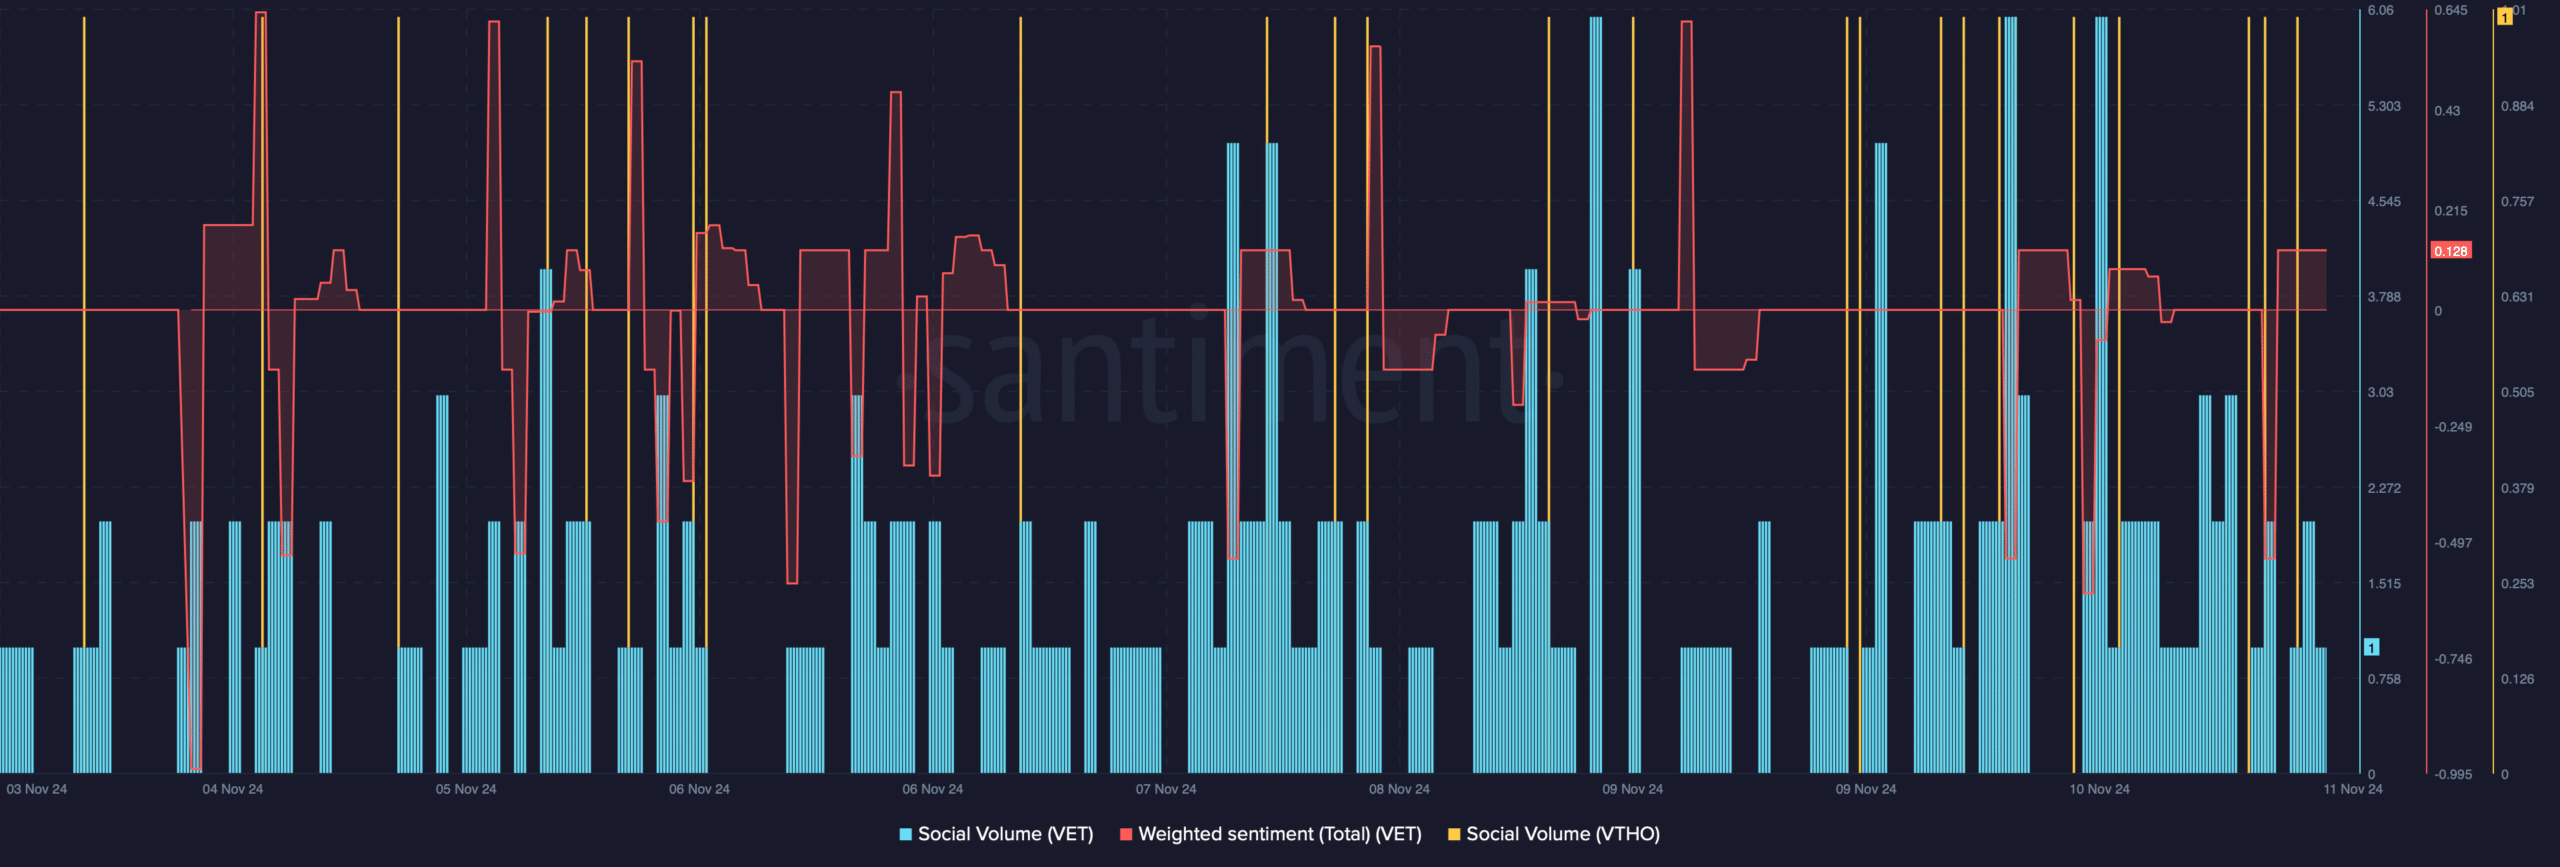
AMBCrypto’s analysis of Santiment’s data revealed that these tokens’ social metrics were also impacted because of this price hike.
We found that both VET and VTHO’s social volumes increased, reflecting a rise in popularity. VET’s Weighted Sentiment also turned positive after dipping sharply.
This suggested that bullish sentiment around the token increased off late.
What to expect from VET and VTHO
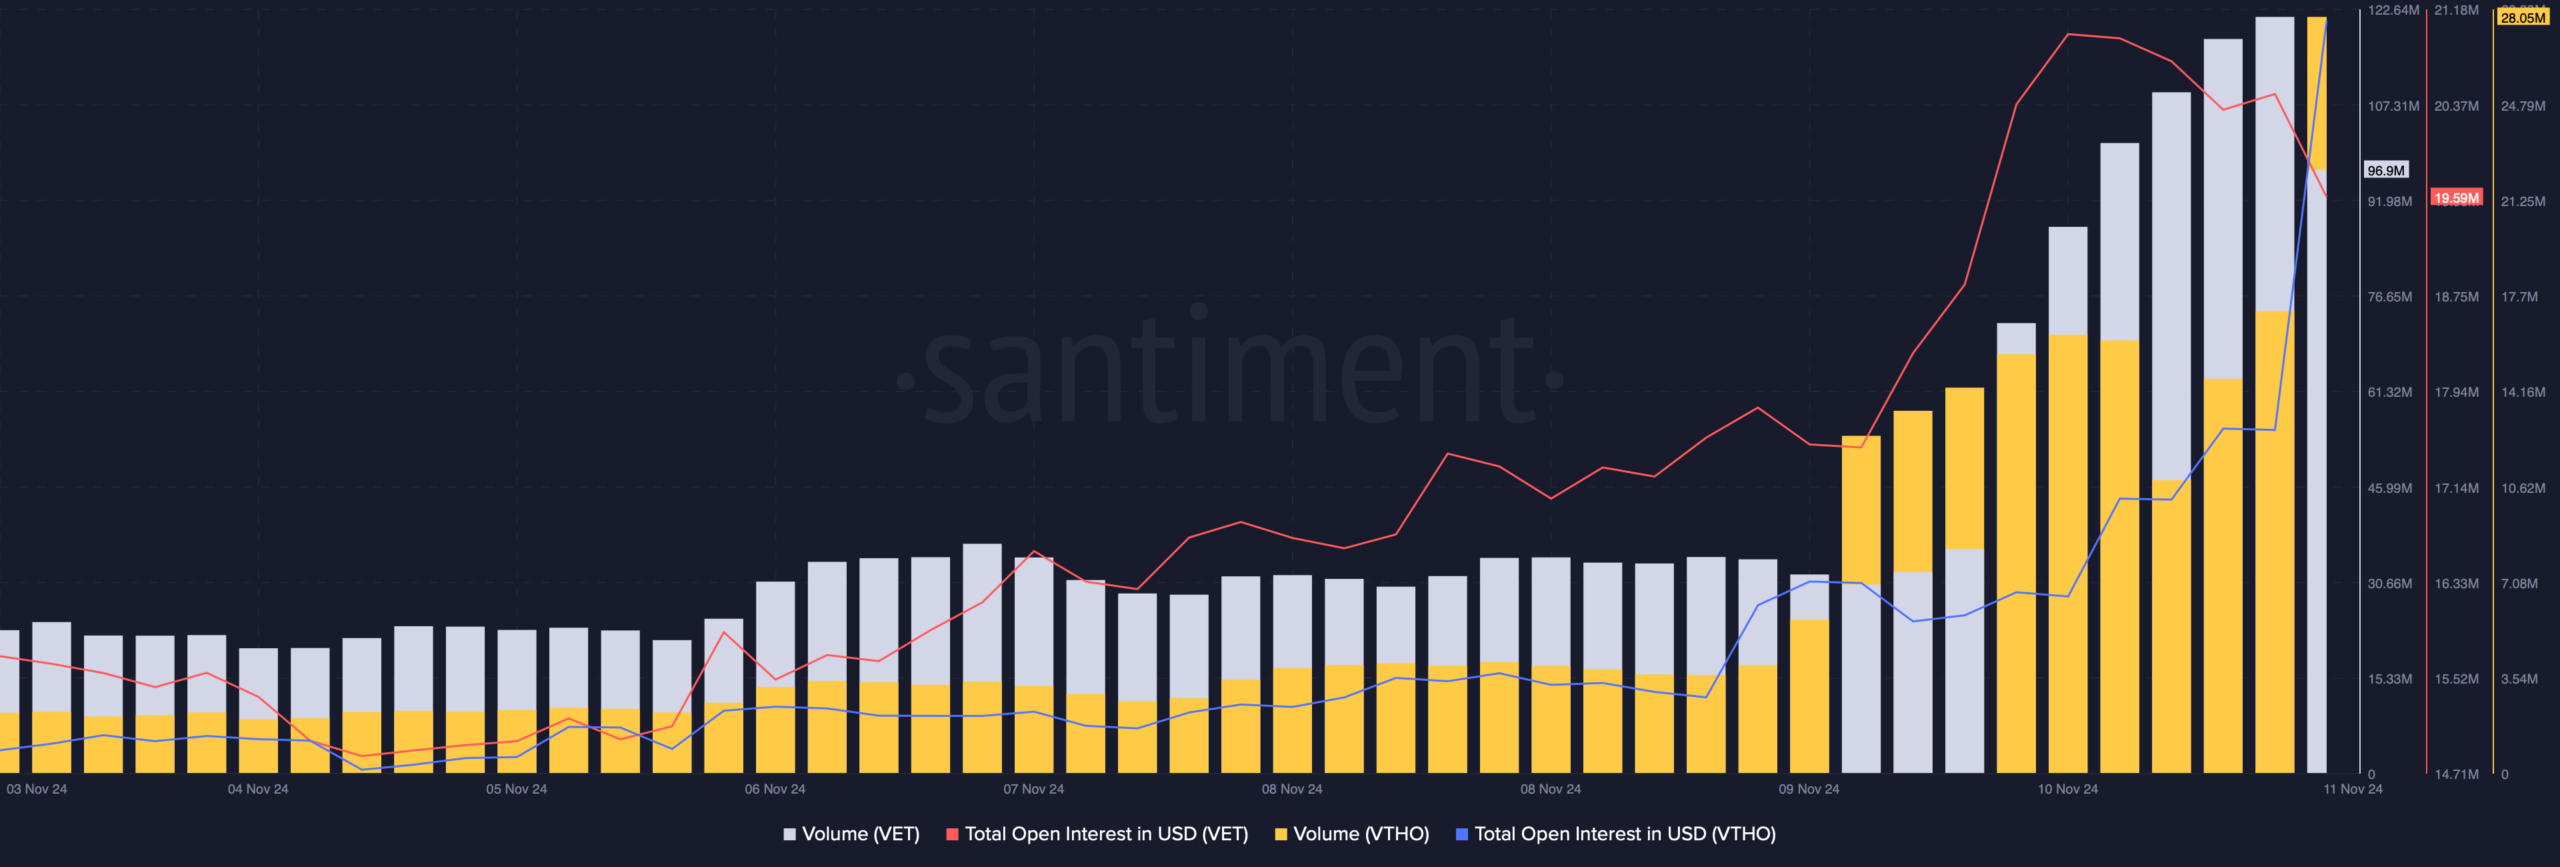
We then checked both tokens’ on-chain data to find out whether this price increase will last. Both VET and VTHO’s trading volumes increased.
Whenever the metric rises amidst a price hike, it acts as a foundation for a bull rally.
VET and VTHO’s Open Interest also increased, meaning that the chances of the ongoing price trend continuing are high.
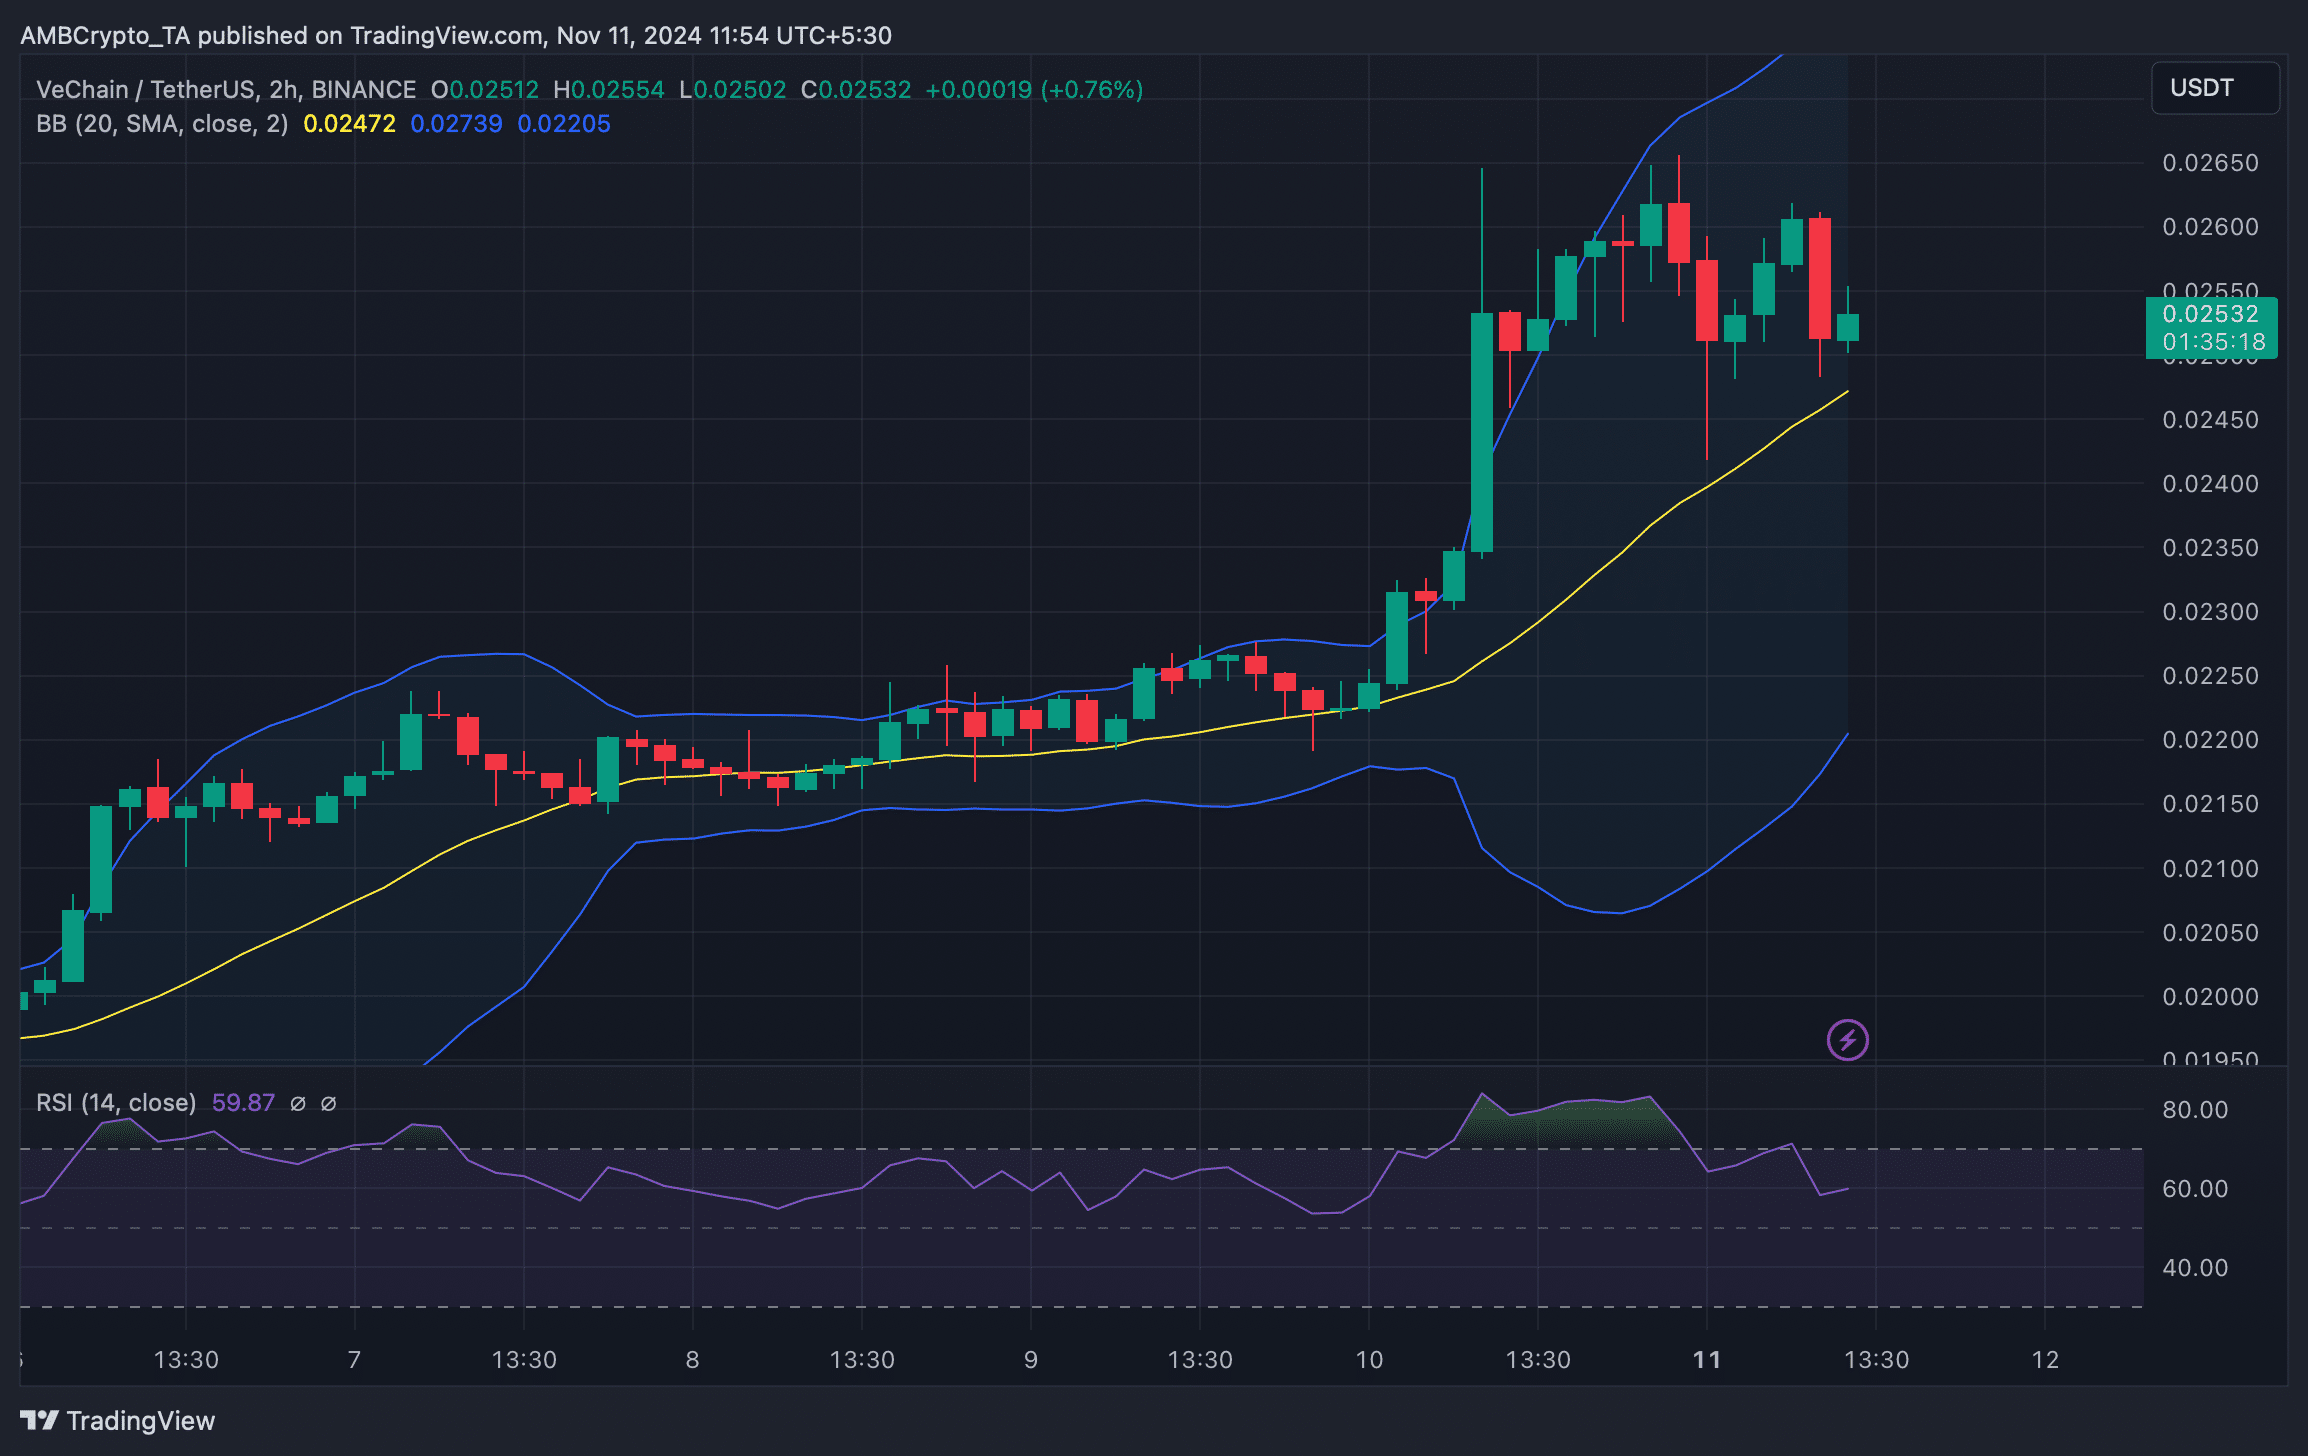
According to TradingView’s chart, VET witnessed a pullback after touching the upper limit of the Bollinger Bands.
At the time of writing, VeChain was approaching its support near the 20-day simple moving average (SMA).
While that happened, VET’s Relative Strength Index (RSI) moved southwards, indicating that the chances of VET testing the 20-day SMA support were high.
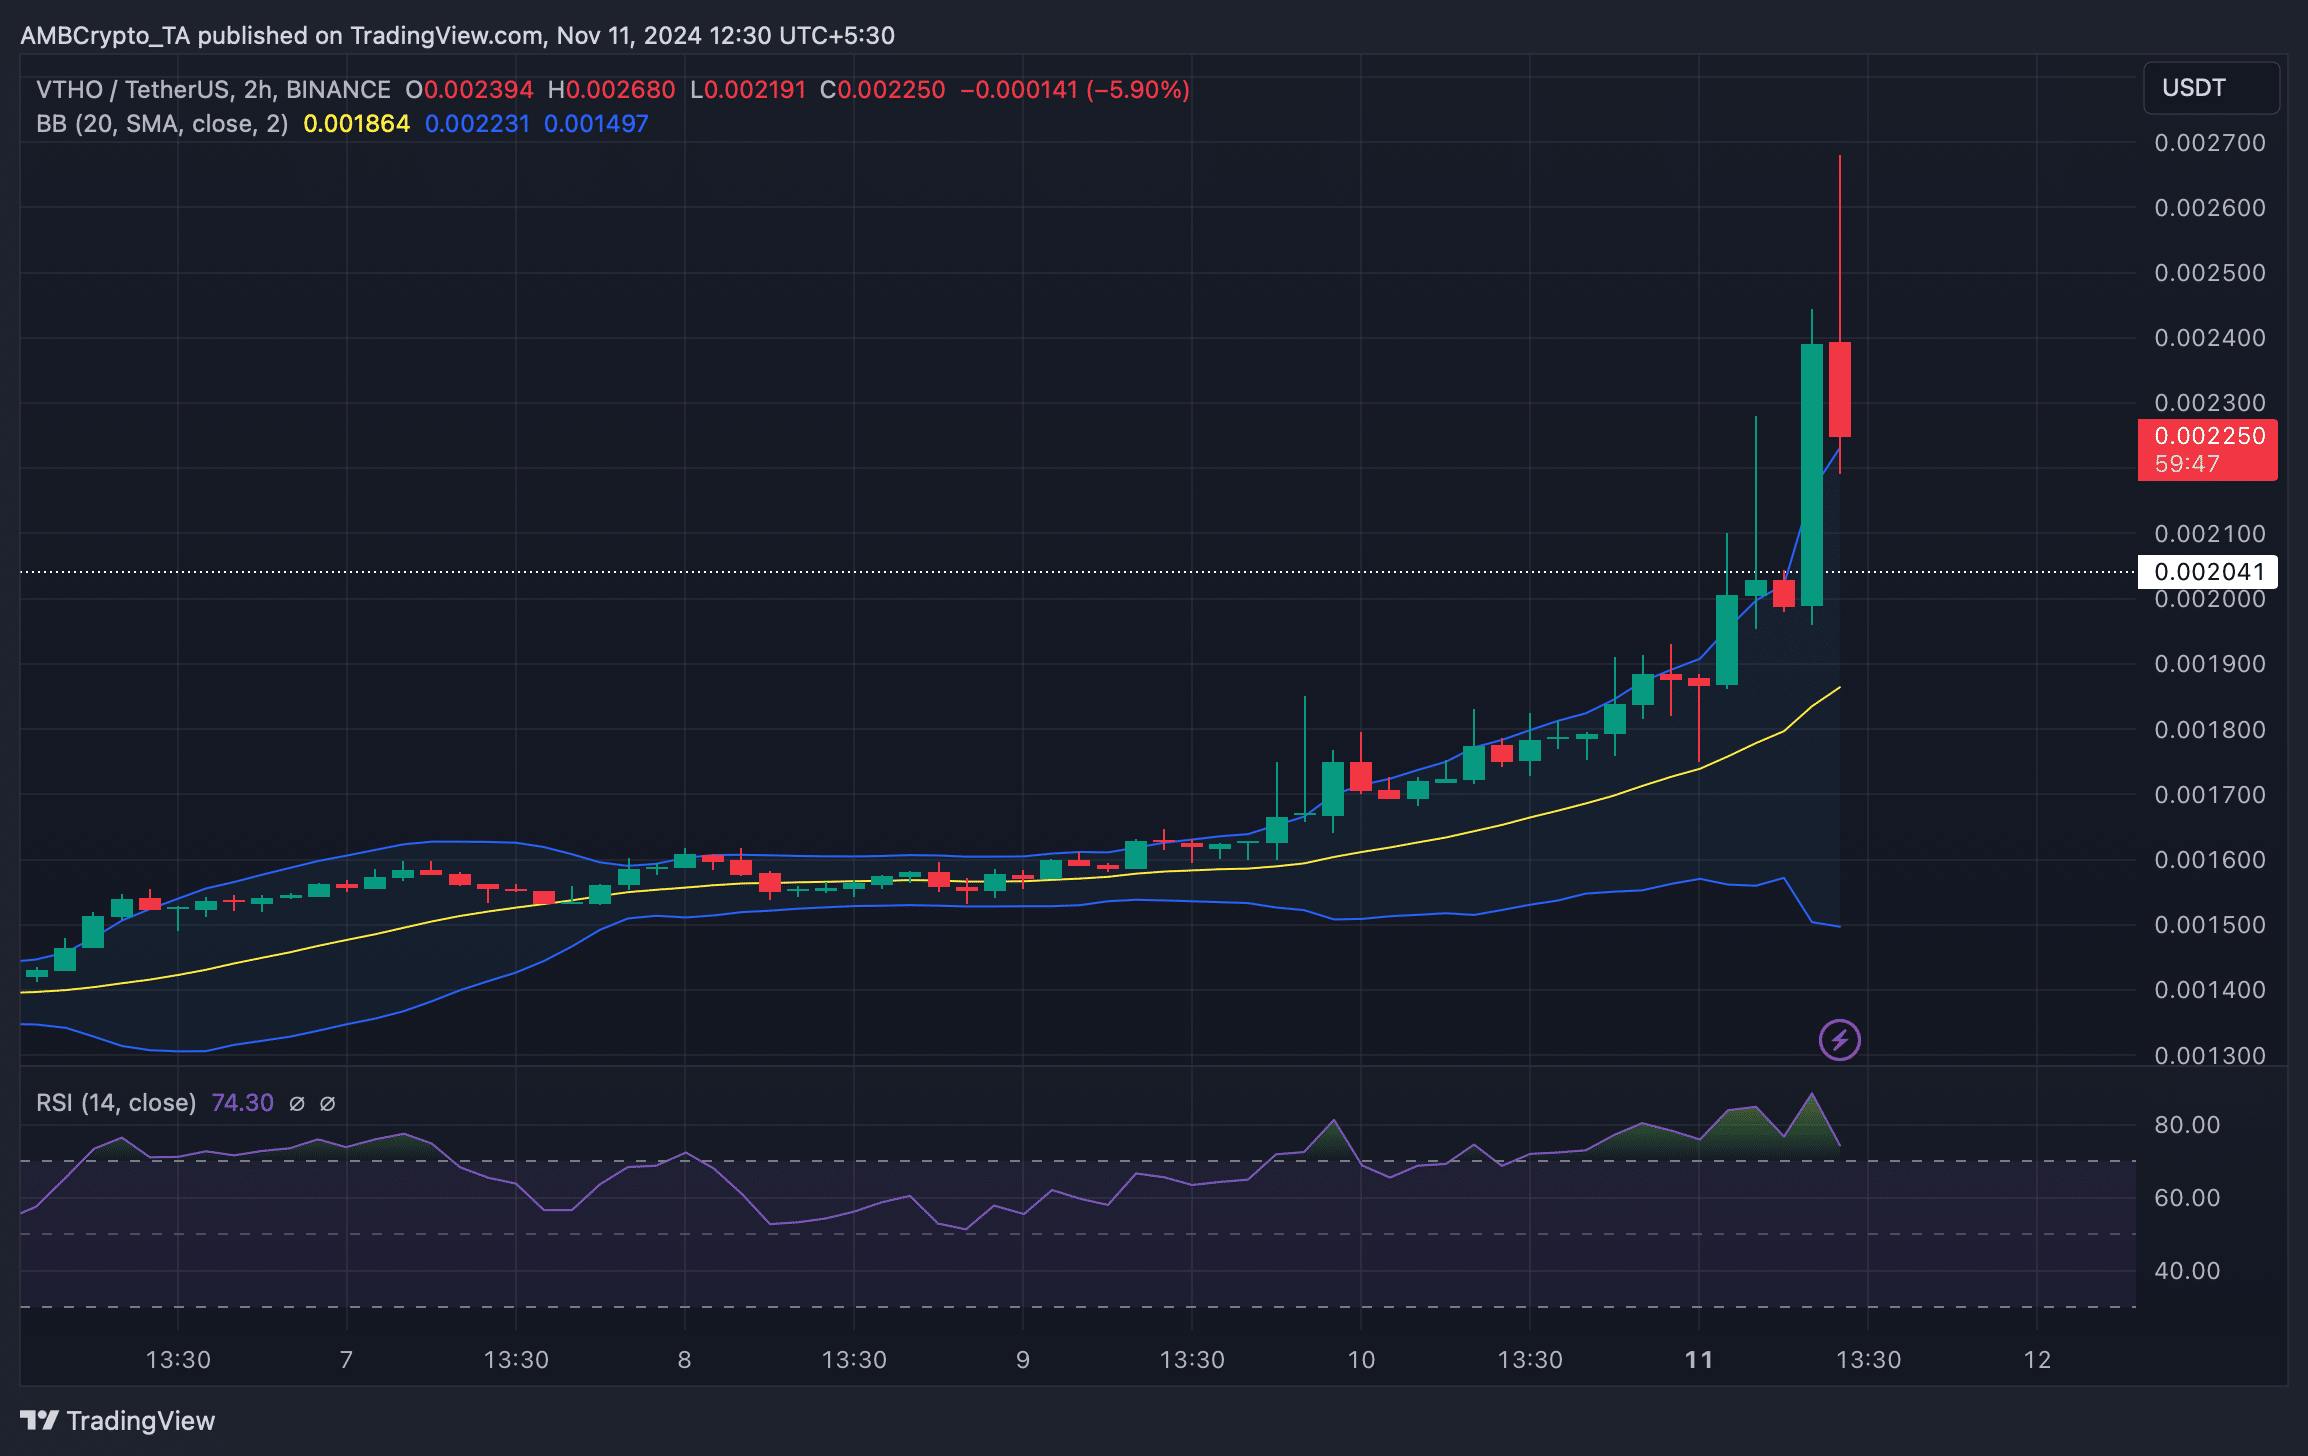
Things for VTHO were a bit different. The token experienced a massive price increase in the last 24 hours.
This pushed the token’s price above the upper limit of the Bollinger Bands, meaning that there were chances of a price correction.
Read VeChain’s [VET] Price Prediction 2024–2025
On top of that, VTHO’s RSI was resting in the overbought zone. Whenever that happens, it indicates that selling pressure might rise, which could trigger a price drop in the coming days.
In the event of a price correction, investors might see VTHO falling to its support near $0.0020.

