VeChain rises 250%: Here’s why a dip to $0.055 could be a buy signal
In the coming weeks, traders and investors can expect a pullback- it is too late to FOMO and buy the token at these prices.

- VeChain has a strongly bullish market structure across multiple timeframes.
- The token has beaten the 2024 highs and buyers target $0.08 next.
VeChain [VET] gained 25.6% on Monday, the 2nd of December, and has been up 17% in the past eight hours. More gains could follow, but it would be prudent to wait for a dip toward $0.055 before buying VET.
Since the 5th of November, VeChain has gained nearly 250%. VET follows the trend of older tokens leading large-cap altcoins in this bull run, such as Stellar [XLM] and Ripple [XRP].
3-day RSI, OBV close to the April 2021 highs
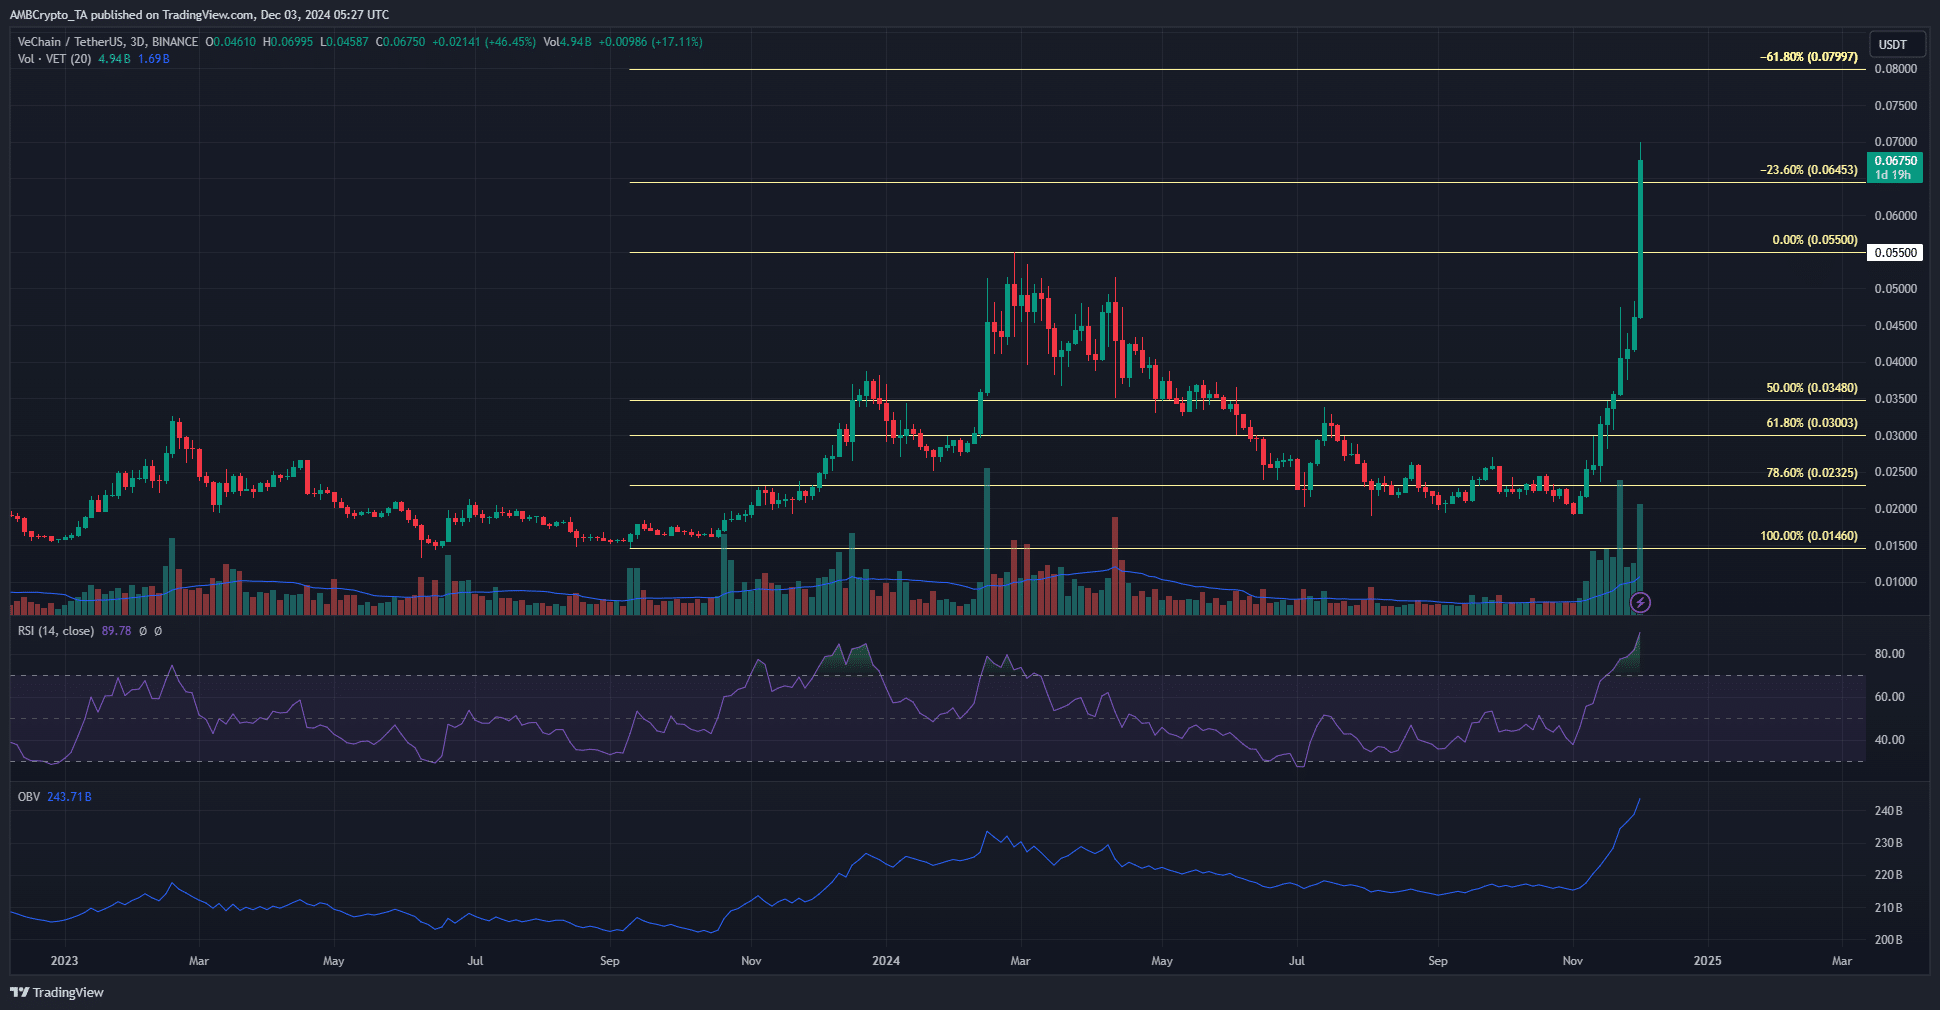
The 3-day chart showed that the highs from March were convincingly breached. Additionally, the price was beyond the 23.6% extension level plotted based on the rally in early 2024. This is a sign of strong bullish intent and the price is likely to climb higher.
The RSI on the 3-day chart was at 89, a value that the indicator has not reached since mid-April 2021. That was when VET reached its all-time high at $0.281. It is 75% down from this point. To the north, the next notable resistance levels beyond $0.0645 are at $0.08 and $0.095.
Like the RSI, the OBV also pushed dramatically higher. It reached levels that the OBV previously visited in April and May 2021. While it denotes high buying pressure, it also raised concerns that this might be the top for VeChain.
It is unclear whether that is the case. In the coming weeks, traders and investors can expect a pullback- it is too late to FOMO and buy the token at these prices.
Liquidity builds up around $0.065
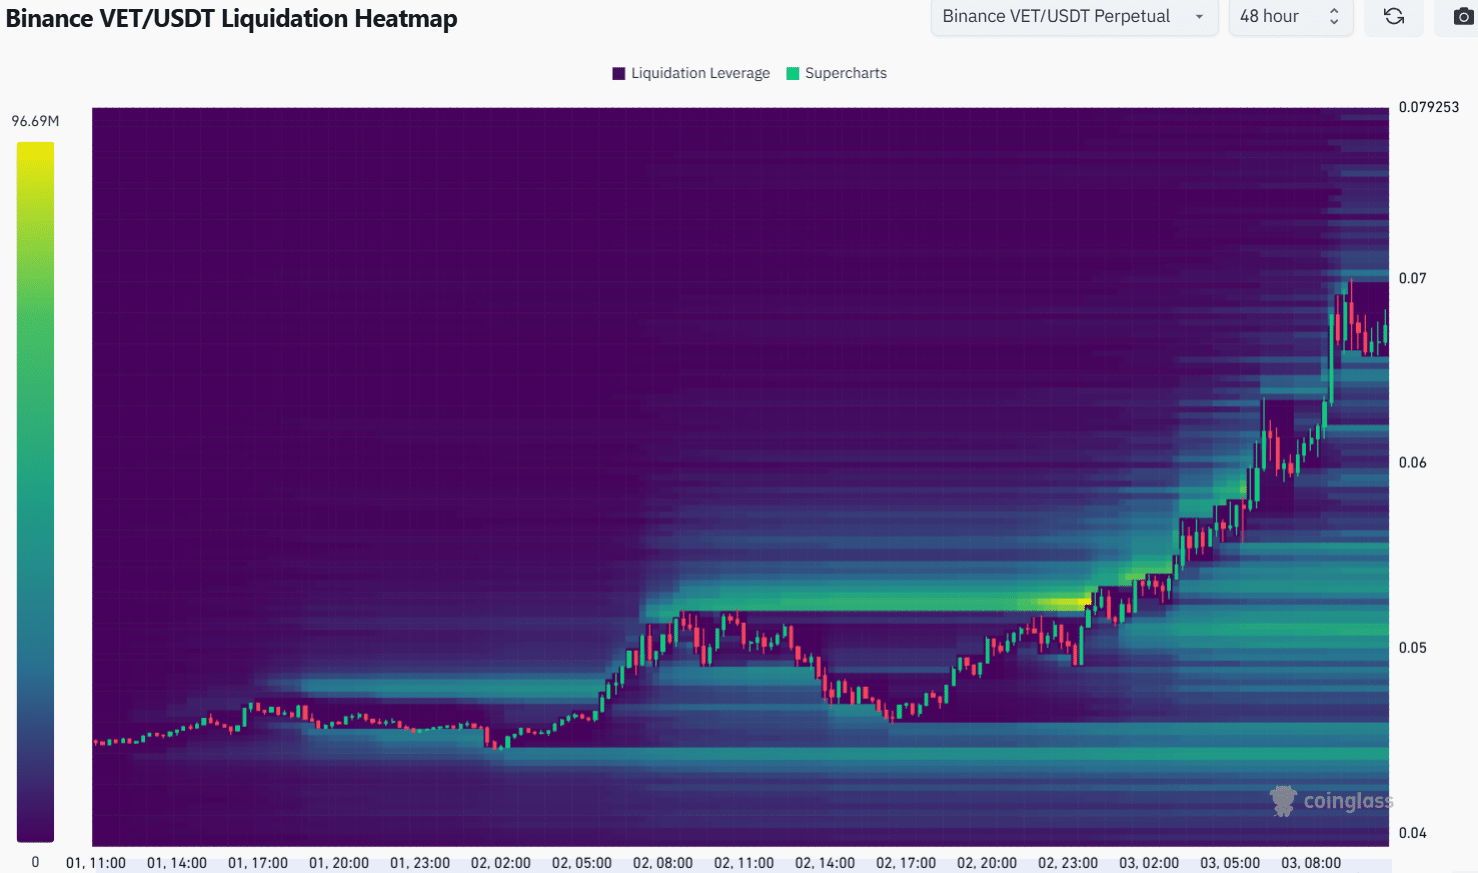
The past 48 hours’ liquidation heatmap outlines the $0.07 and $0.065 areas as nearby liquidity clusters. These regions on the price chart are expected to act as a magnetic zone and attract prices toward them.
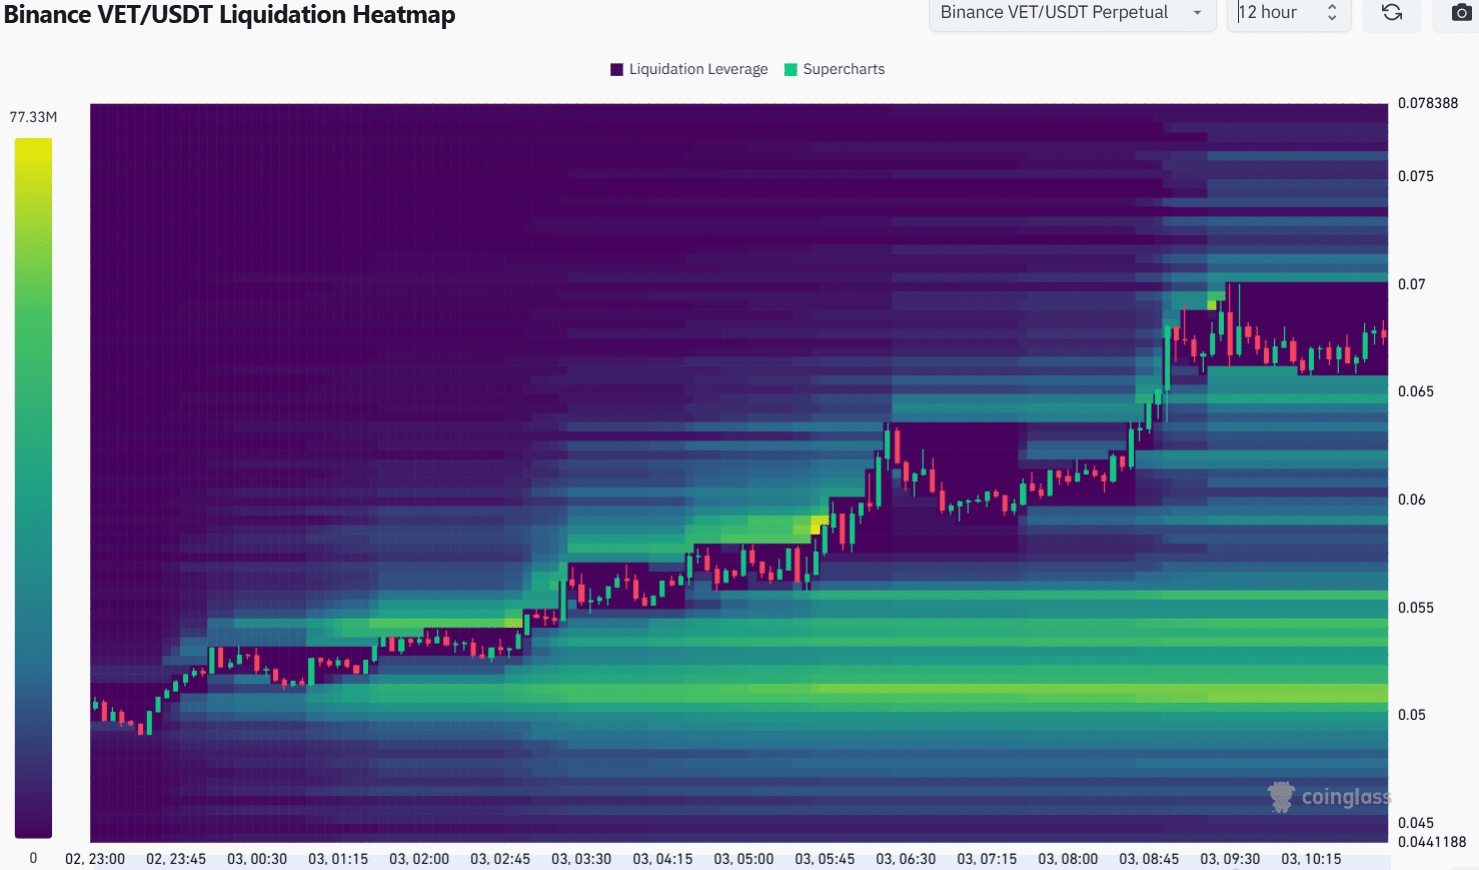
Zooming in, we can see that the $0.065 and $0.055 are the closest liquidity pools of significant size. The rapid gains for VeChain in the past few weeks meant the market had little time to consolidate at key levels.
Read VeChain’s [VET] Price Prediction 2024-25
Hence, traders should be prepared for a dip toward $0.055, but that does not warrant short-selling. The higher timeframe trend is clearly bullish and any pullbacks would likely be bought up quickly.
A VeChain price drop below $0.04 would be a strong sign that the bulls have lost considerable strength, and that the uptrend could be fading. Till then, investors and traders need to be bullishly biased.
Disclaimer: The information presented does not constitute financial, investment, trading, or other types of advice and is solely the writer’s opinion