WAVES is at a crossroads; watch these levels over the next few days

Disclaimer: The findings of the following analysis are the sole opinions of the writer and should not be considered investment advice
Waves has been on an uptrend over the past week, firmly flipping its near-term market structure to lean bullish. The price was again at a support level and could see demand step in to drive prices higher in the coming hours.
However, Bitcoin struggled to overcome the $44.4k resistance level and has been unable to push convincingly past $45k. This could see BTC drop towards the $42k-$43k area, something that could see a pullback across the altcoin market as well.
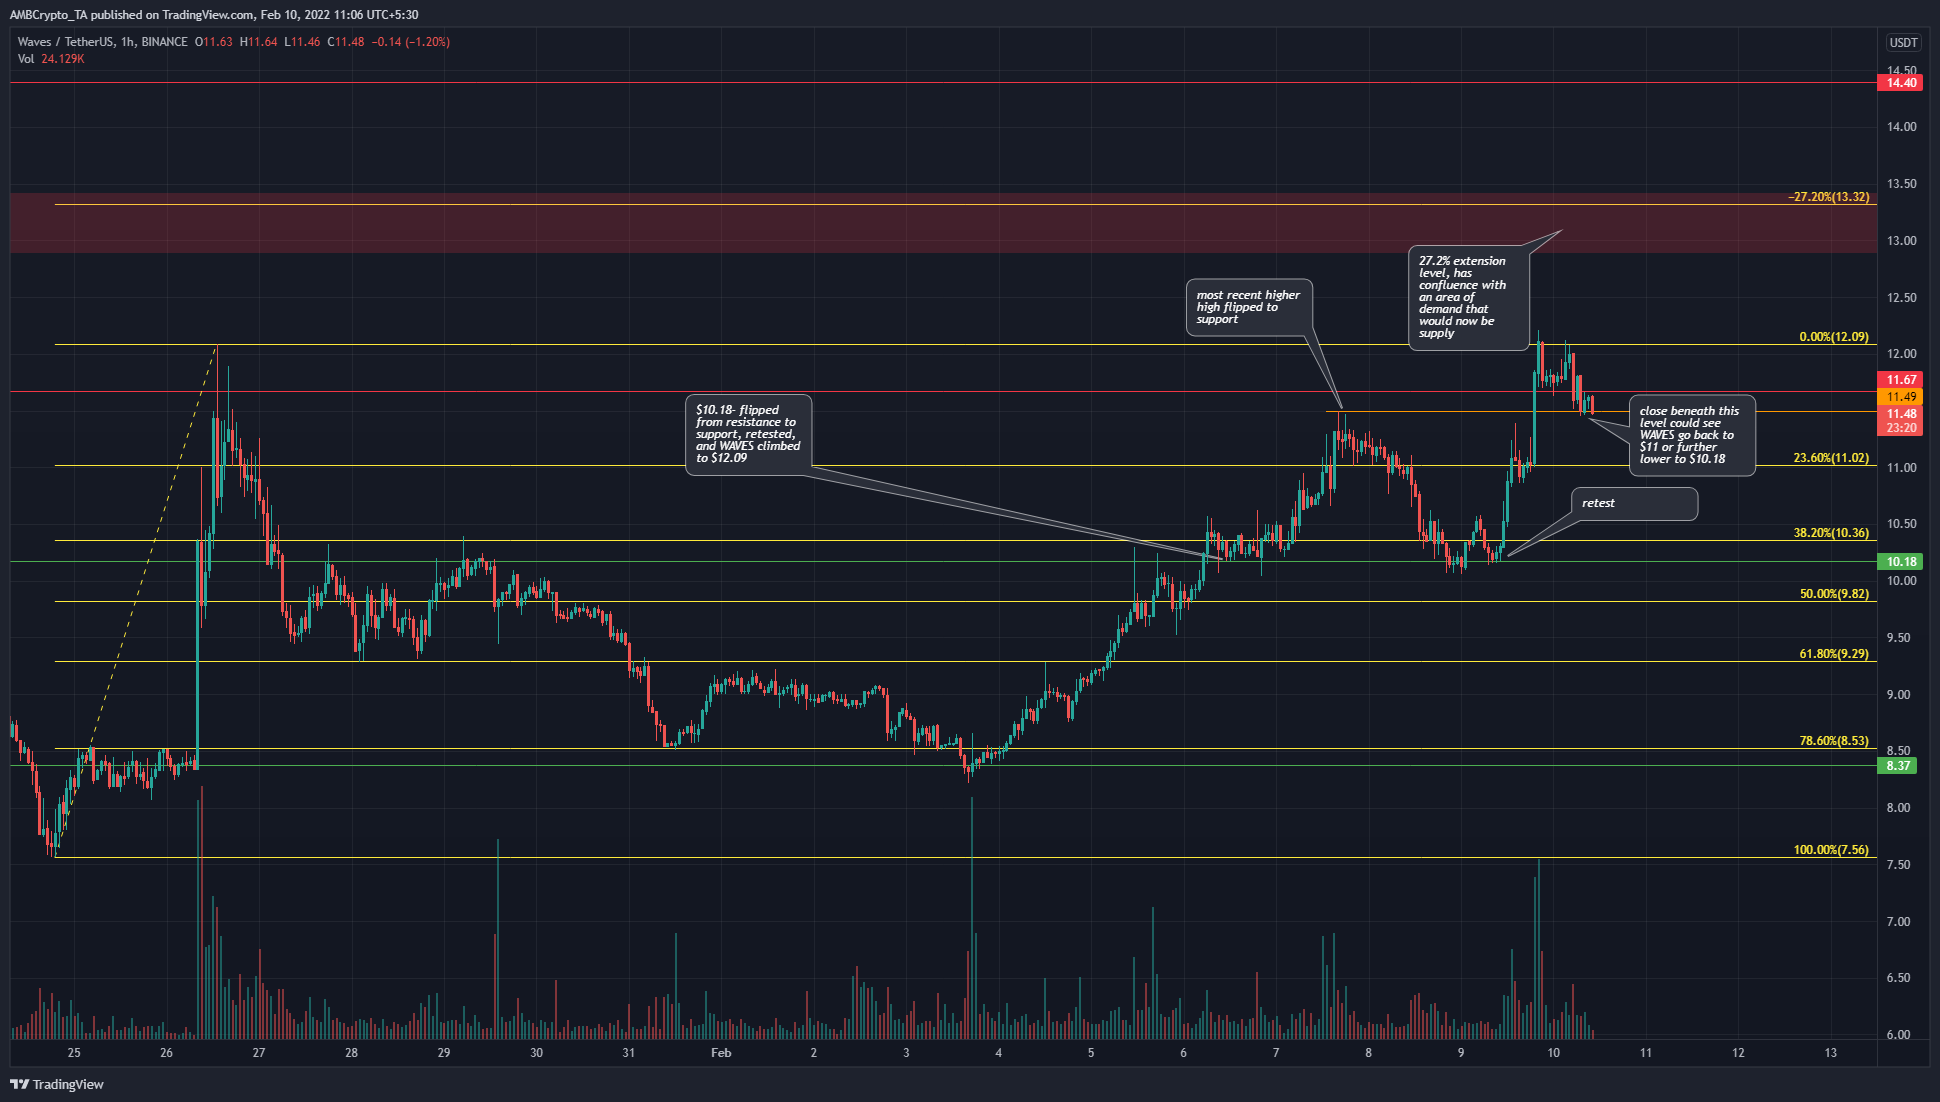
Based on WAVES’s bounce from $7.56 to $12.09 in late January, a set of Fibonacci retracement levels (yellow) were plotted. It was observed that the price retraced as far south as $8.37, which was just below the 78.6% retracement level (8.53) of the aforementioned move.
Since then, momentum has been bullish and WAVES was able to register a series of higher highs and higher lows to establish a short-term uptrend to $11.48. Once again, the price retraced but only so far as $10.18.
The price found demand at $10.18 on two separate tests within a matter of hours, and bullish momentum soared alongside trading volume in the last 24 hours. The price hit $12.21, just above the swing high chosen for the Fibonacci retracement levels, but sellers pushed the price lower once again.
At press time, WAVES was trading at $11.48, and a session close beneath $11.48 would likely see WAVES pushed lower to $11.02 and $10.18. This is because such a candle close would see a recent higher high broken. This would indicate that the bears will be in the driving seat in the hours to come.
Rationale
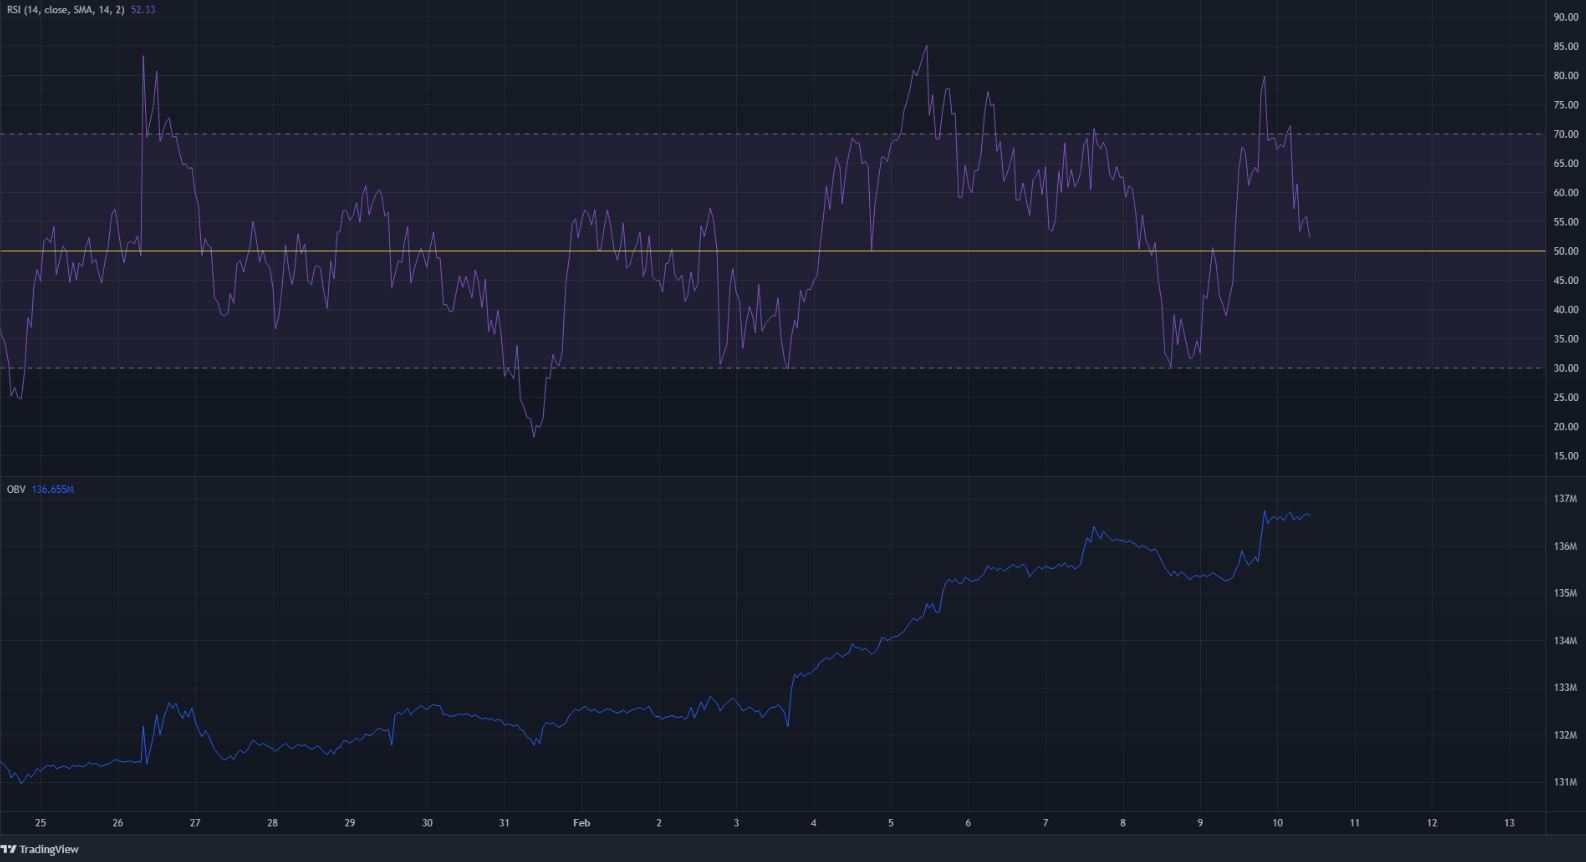
The RSI on the hourly chart swung from 30 to 70, indicative of ranging price action. If this were to continue, the next buying opportunity would be when the RSI nears 30 while the price also trades near a strong support level.
The OBV has been steadily rising over the past two weeks. This showed that buying volume was greater than selling volume, and demand was genuine behind WAVES’s recent impulse bullish move.
Conclusion
In the next few hours, the defense (or lack of) of the $11.48-level by bulls would have an impact on the direction of the price. To the south, support lay at $11.02 and $10.36-$10.18. A bullish move from $11.48 could climb to the $13.32 level, which has confluence with a former area of demand for WAVES in the past month.


