What Chainlink [LINK] traders should know before cutting losses

Chainlink’s 7-day performance was commendable as it considerably outperformed most of the cryptos with higher market capitalization. The token registered more than 13% weekly gains with no red on its chart.
At press time, LINK was trading at $7.18 with a market cap of $3,529,540,526. While LINK continued to grow on its chart, several developments happened in its community. Whales’ interest in LINK has been growing of late. This might have fueled the consistent surge in price.
Development activity pumped
During the last week, Chainlink’s development skyrocketed as there were 11 integrations of three Chainlink services across five different chains, namely, BNB, Ethereum, Phantom, Polygon, and Solana.
Such developments in an ecosystem are always a positive signal as they reflect the efforts of the developers to improve a network. Interestingly, LINK’s price corresponded to this.
⬡ Chainlink Adoption Update ⬡
This week, there were 11 integrations of 3 #Chainlink services across 5 different chains: #BNBChain, #Ethereum, #Fantom, #Polygon, and #Solana.
Chainlink helps secure the #Web3 ecosystem. pic.twitter.com/uLU0UhN6Ap
— Chainlink (@chainlink) September 4, 2022
Moreover, the surge was also backed by higher volume, which could make the hike more stable. Interestingly, Whalestats’ tweet revealed that LINK was among the most popular tokens that the top 500 ETH whales were holding.
Therefore, it is evident that the investors have faith in the token as they expect it to rise further in the days to come.
https://twitter.com/WhaleStats/status/1566404312082927616?s=20&t=Coi6EyraToVnaM7MfrLTYQ
Additionally, last week, Chainlink also flipped WETH to become the most traded token among the top 500 ETH whales.
https://twitter.com/WhaleStats/status/1564404357382213632?s=20&t=2aZ2wbDFeCRIgCIFskrTzA
What metrics suggest?
The good news for LINK is that its price surge was also backed by several on-chain metrics. According to CryptoQuant’s data, LINK’s exchange reserves declined by 2% in the last seven days, which is a bullish sign as it indicates less selling pressure.
Moreover, the number of active addresses and total transaction count increased in the last 24-hour period, suggesting more user activity on the network.
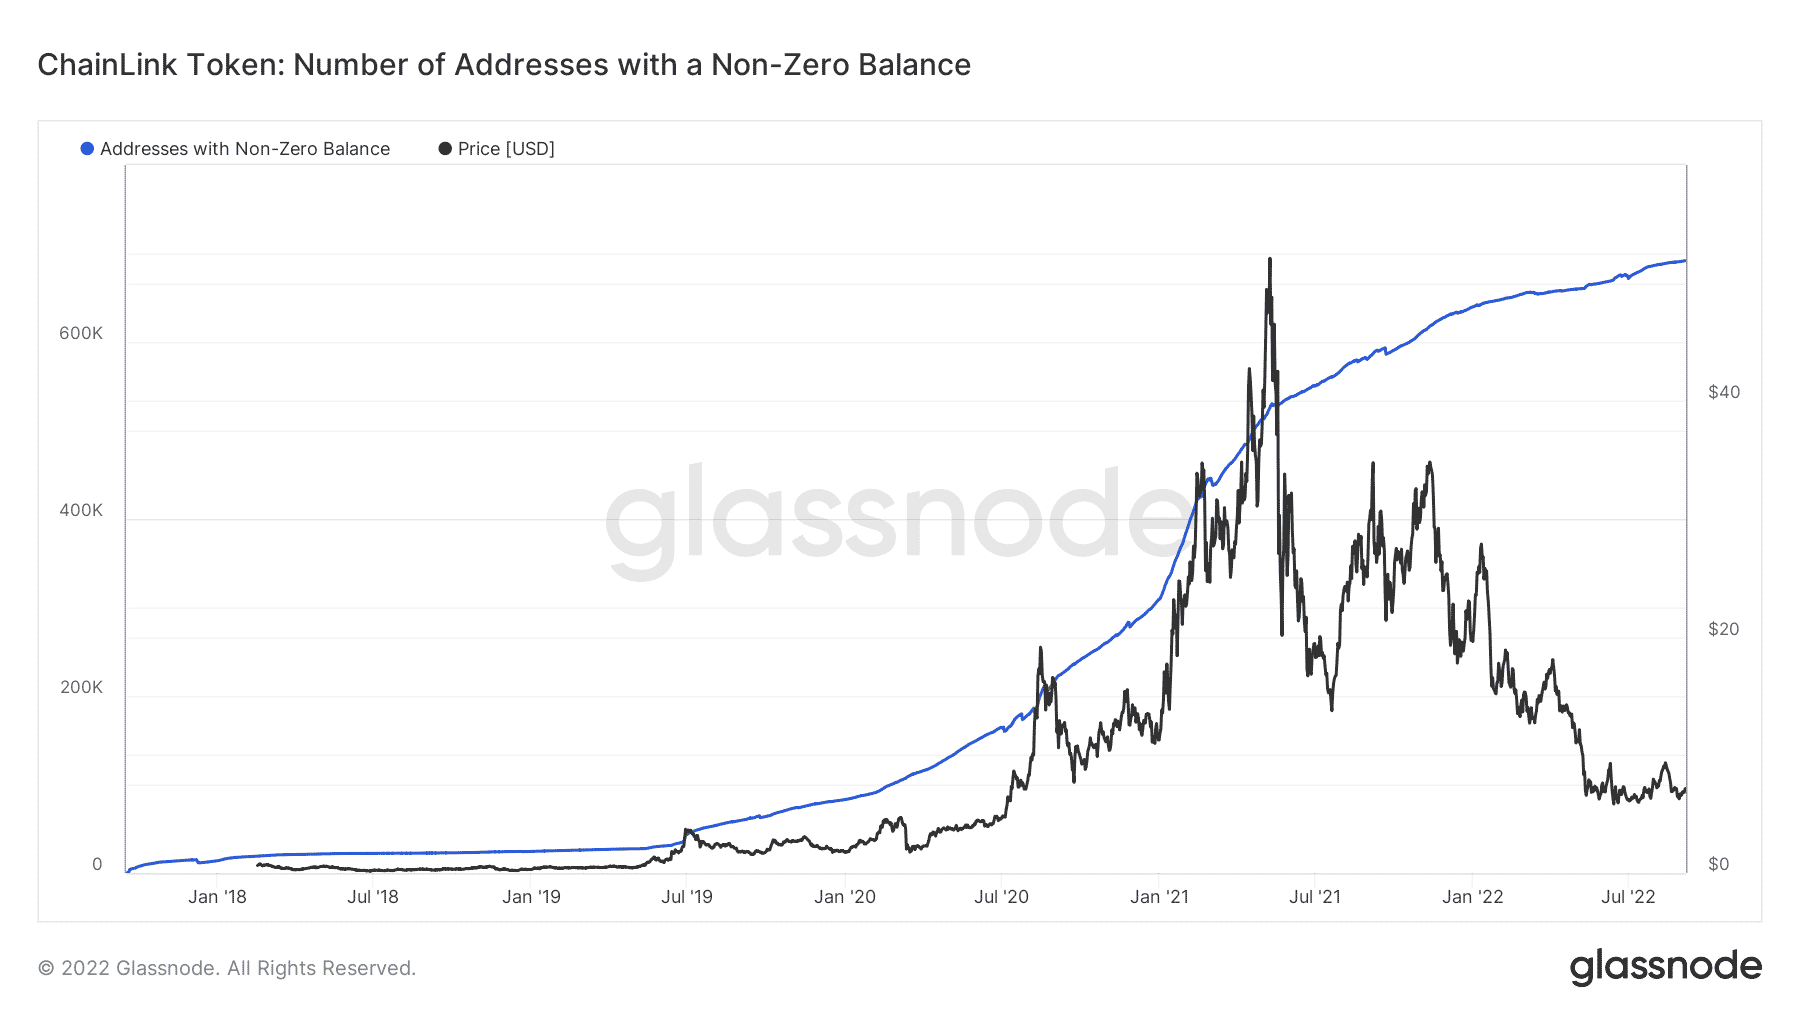
Chainlink’s number of addresses with non-zero balances reached an all-time high, which is a clear indication of the immense confidence of investors in the coin.
Nonetheless, nothing can be said with utmost certainty in this volatile crypto industry, which is evident by looking at a few other metrics.
For instance, LINK’s exchange outflow fell considerably while its price surged in the past week, indicating a possible bear market ahead.
Looking forward
Though the metrics and LINK’s past performance indicated better days ahead, a look at LINK’s daily chart suggested a bearish edge in the market.
The 20-day EMA was below the 50-day EMA, which further suggested a seller’s advantage.
RSI and CMF pointed out that the market was in a neutral condition. Moreover, Bollinger Bands showed that after being in a high volatility zone, LINK’s price was about to enter a crunched zone. Thus, minimizing the chances of further uptrend in the short-term.


