What ETC bears need to keep in mind before going short

Ethereum Classic (ETC) withdrew in a descending channel (yellow) since its November highs. Post which, the bulls initiated a breakout rally while jumping above some critical price points.
After the recent buying rally, ETC entered into a low volatile phase in the last ten days. Now, as the bears are keen on defending the $49-mark, the alt could see a sluggish stage before a trend committal move. Any fall below the 20 EMA (red) could be detrimental to the bullish vigor. At press time, ETC traded at $46.32.
ETC Daily Chart

The down-channel (yellow) retracement saw a nearly 66.9% fall while the selling spree halted at the $22-base. Interestingly, ETC noted an over 119% ROI from its nine-month low on 22 January as it jumped above its 20/50/200 EMA’s. But, it struggled to overturn the $49-mark that coincided with the ten-week trendline resistance.
After breaking out of its long-term down-channel, the alt saw a short-lived rally that tested the upper trendline of the down-channel. Then, the bulls steered the direction in their favor while marking multiple bullish engulfing candlesticks.
With the 20 EMA crossing the 200 EMA (green), the bulls made their intentions clear on the long-term tendencies. Thus, losing the $45-support could propel a test of the 20 EMA. Further, a continued pullback could reverse from the $38-$40 zone. If the 50 EMA crosses the 200 EMA, the alt would aim to challenge its trendline resistance near the $53-mark.
Rationale
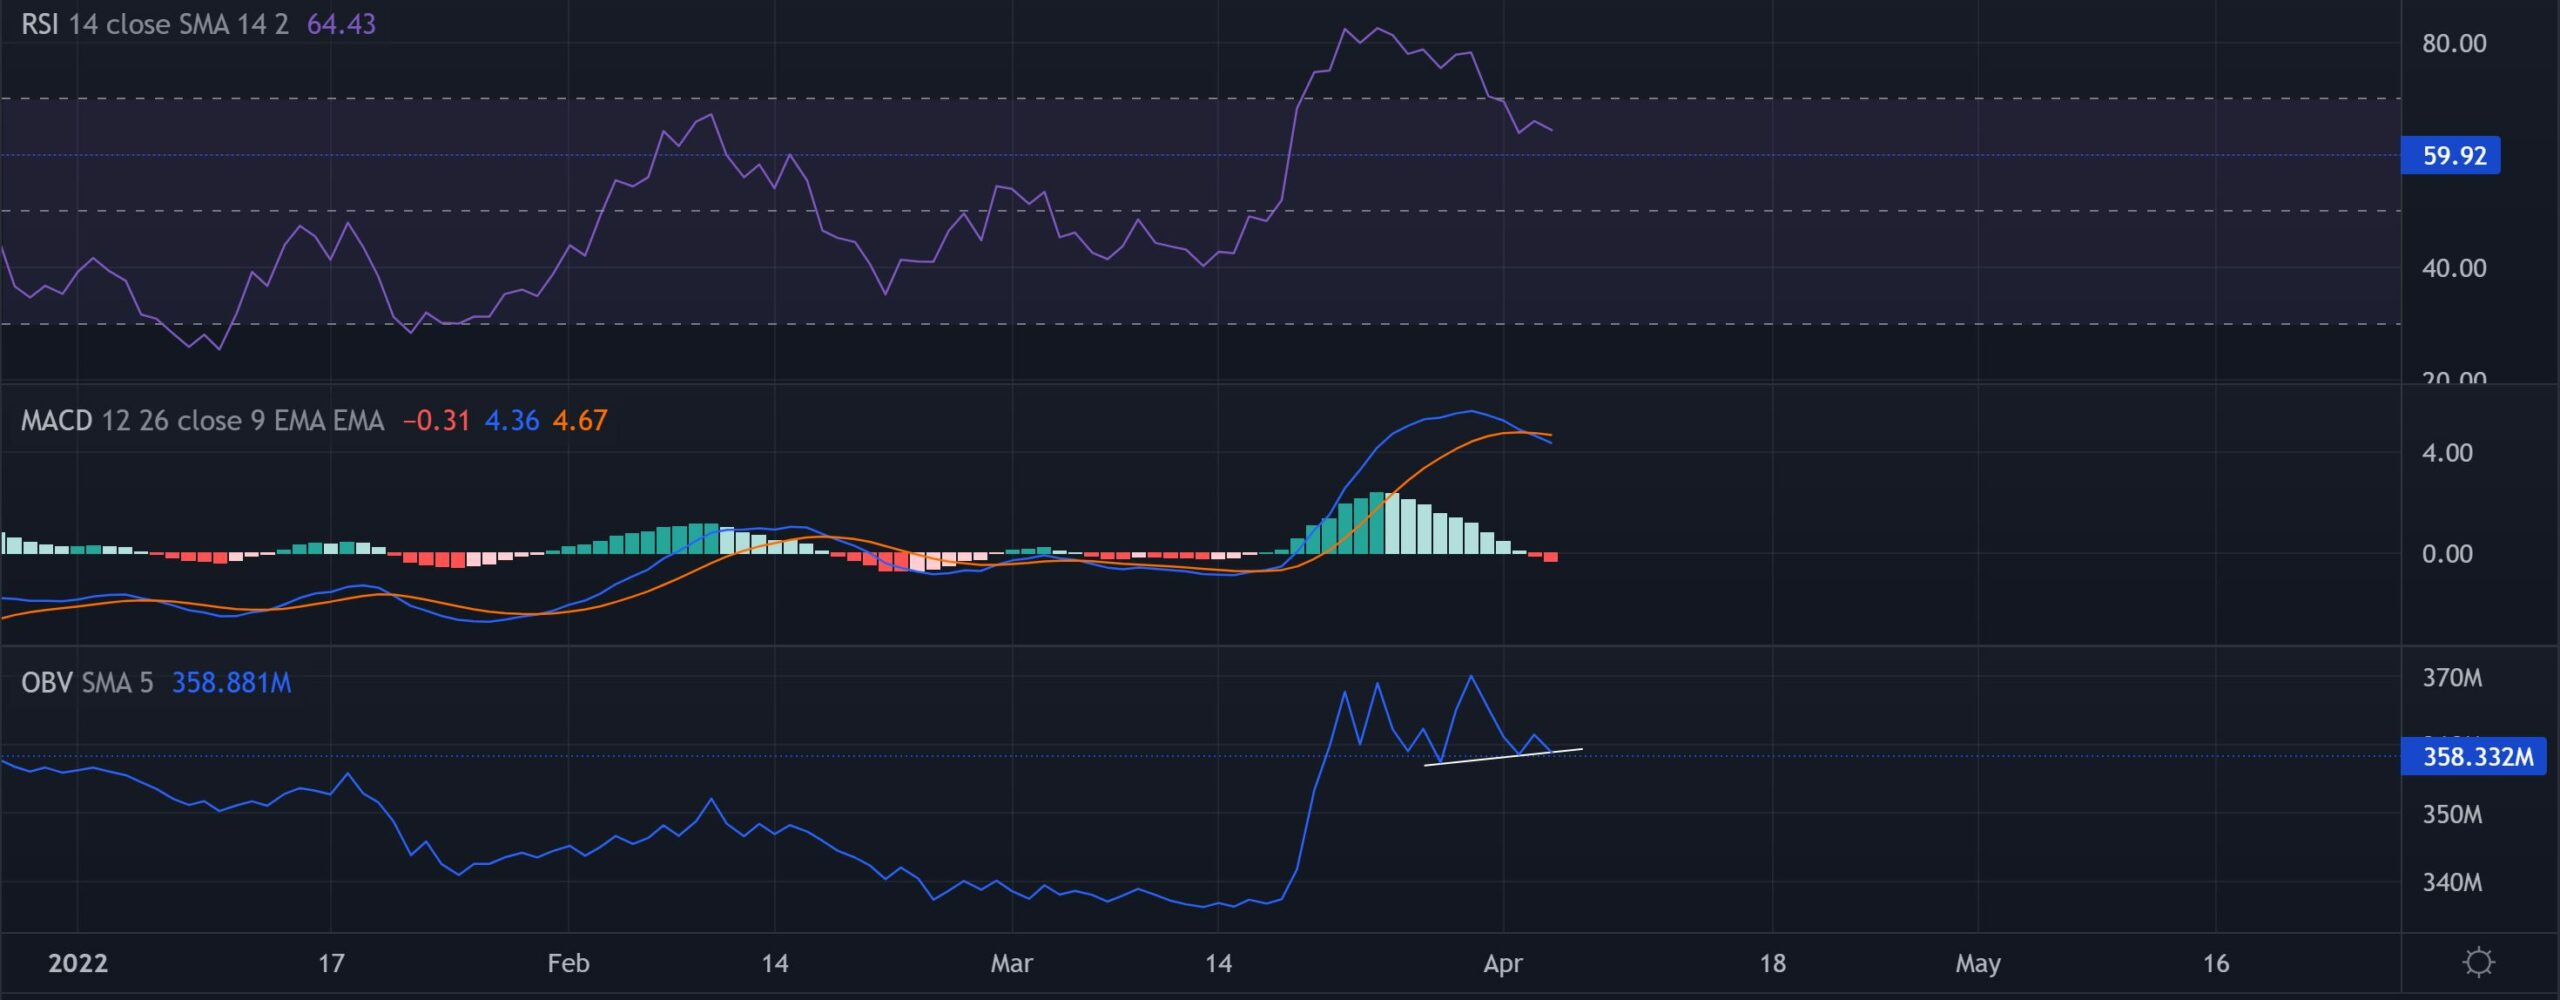
After falling from the overbought territory, the RSI now aimed to test the 59-support. A fall below that level would open up gates for the price to test the 20 EMA.
Further, the MACD lines undertook a bearish crossover while the histogram dipped below the zero-line. This reading hinted at a slightly decreasing buying edge. But the OBV saw higher troughs in the last week. Thus, ETC could test its immediate resistance before a possible fallout.
Conclusion
Considering the readings on its MACD, the buyers were losing their edge. So, a possible test of the 20 EMA before continued bullish movements seemed probable.
Besides, the broader market sentiment and the on-chain developments would play a vital role in influencing future movements.